
Some Log Type Estimators For Estimation of Population Mean of Sensitive Variable Using Additive Scrambling Model
Mojeed Abiodun Yunusa1  and Awwal Adejumobi2*
1Department of Statistics, Usmanu Danfodiyo University, Sokoto, Nigeria .
2Department of Mathematics, Kebbi State University of Science and Technology, Aliero, Nigeria .
http://dx.doi.org/10.13005/OJPS09.02.09
Since it can be challenging to estimate the mean of a sensitive study changeable when direct methods of information collection are used to elicit sensitive information, through the use of the randomized response technique (RRT), protect respondents' privacy while also obtaining more valid and reliable information. The present study introduces a set of log-type estimators for calculating averages through the utilization of the additive scrambling model. The estimators' mean square error (MSE) is determined a maximum of two degrees. There are defined circumstances in which the estimators perform better. An investigation was carried out utilizing three datasets, and the findings indicated that the suggested estimators outperform estimators found in the previous research both in efficiency comparison and empirical investigations. The first table shows the Mean Square Errors (MSEs) of the proposed and existing estimators used in this research, and we found out that Zp7 has the smallest MSE, followed by the Zp1, Zp2 , Zp3 , Zp 4 and co. The second table show the same results where Zp7 is having highest Percentage Relative Efficiecy (PRE), then other estimators follows. This explain that it is the most efficient estimator in this research.
Copy the following to cite this article:
Yunusa M. A, Adejumobi A. Some Log Type Estimators for Estimation of Population Mean of Sensitive Variable Using Additive Scrambling Model. Oriental Jornal of Physical Sciences 2024; 9(2).
DOI:http://dx.doi.org/10.13005/OJPS09.02.09Copy the following to cite this URL:
Yunusa M. A, Adejumobi A. Some Log Type Estimators for Estimation of Population Mean of Sensitive Variable Using Additive Scrambling Model. Oriental Jornal of Physical Sciences 2024; 9(2).Available here:https://bit.ly/3ZBFIRm
Download article (pdf) Citation Manager Publish History



Introduction
Today's society is filled with many delicate topics, like cases of rape, sexual practices, earned income that is not legal, etc. It can be challenging to gather information on these topics when using the direct questioning technique, which will ultimately lead to unreliable information gathered from respondents and unreliable estimates from measuring the study variable's parameter that is sensitive in nature. We employ a covert technique to gather information from interview subjects while maintaining their privacy in order to produce more accurate data and a trustworthy estimate. When data on delicate subjects are tainted by response bias and non-response, estimation becomes problematic. The tacit means of acquiring private data is employed to counter this. 34 was the one who first presented the technique. Subsequently, 24, 34, 35 introduced the quantitative version of their questionnaire to gather quantitative data on delicate topics for mean estimation. The use of additive models to get respondents to give randomized or scrambled responses was first introduced by 9. 24 presented and applied the multiplicative scrambling model. Additional references are 2,6,8,10,13,14,15,16,17,20,22,26,28,31.
Numerous authors, including 1,3,4,5,7,12,18,21,27,29,33,36. 11,19,23,25,30 are among the researchers who have worked on sampling surveys and have calculated the population mean of the study variable that is sensitive when the auxiliary variable that is not sensitive is present.. In order to achieve precision, we plan to propose a few log-type estimators for the population mean estimation of sensitive study variables in the current study.
Literature Review
Let Z1, Z2,.....,Zn



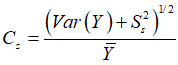
and the correlation coefficient between Z and X is given by
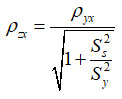
We established the following relationships for the relative error in order to derive the estimators' properties:

Various Current Randomized Response Estimators in the Absence of Auxiliary Information
The first quantitative randomized response technique (RRT) model, known as the additive model, was described by 35 for the purpose of estimating the mean of the quantitatively sensitive study variable. 24 further examined estimation along this line.
When asking respondents for sensitive information, 24 thought that an additive RRT model would be the best option.

An estimator of uy
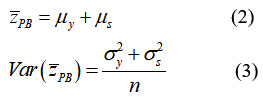
In this case, the distribution of scramble variable S is known beforehand.
An RRT model with multiplicative properties was presented by 9 to extract sensitive data from respondents as

An estimator of
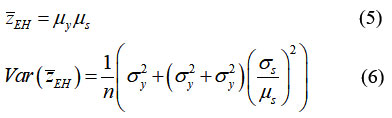
An optional RRT model with one stage multiplicative was proposed by 13. Respondents will give a jumbled response (YS) in this model if they believe the question is sensitive; otherwise, they will directly respond to the sensitive survey question (Y) with their genuine response. In this model, they assume that both Y and S are positive valued random variables and that the mean of the scrambling variable us = 1
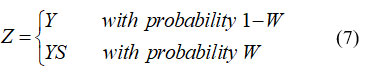
The mean of Z is given by
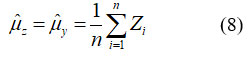
The variance of this unbiased estimator of the population mean

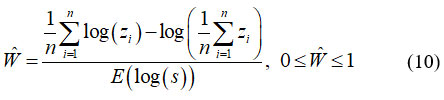
It should be noted that W increases as Var(uy)
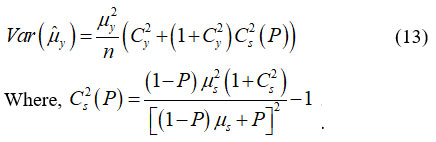
9Multiplicative model was modified by 6 to propose the forced quantitative RRT (FQRRT) model (1983). According to this model, each respondent is asked to use a randomization tool like a spinner to complete a Bernoulli trial. Let P represent the percentage of the delicate question that is answered. In all honesty, the researcher fixes this proportion if the spinner stops in the shaded area; if it stops in the unshaded area, (1-P) represents the proportion of reporting a scrambled response YS. The responses are distributed as follows:

The unbiased estimator for uy

An information-gathering model for Y, the sensitive variable, was presented by 28 using the randomized response technique (RRT). This model is similar to 9 model, but he considered incorporating two scrambled variables S1

The unbiased estimator of uy


The optional scrambling model was presented by 10; they identify Y as the quantitative sensitive variable, S as an additive random variable, and the observed responses from respondents are expressed as
.jpg)
Where, a
An estimator for uy
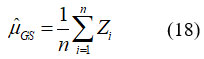
The variance of uGS
.jpg)

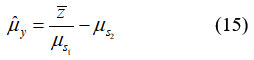
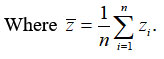
15Proposed a two stage additive optional RRT model with two scrambling variables Si (i = 1,2)

The mean and variance of Z are

The unbiased estimator for uy
15Proposed a two stage multiplicative optional RRT model with two scrambling variables Si (i = 1,2)

The mean and variance of Z are

The unbiased estimator foruy

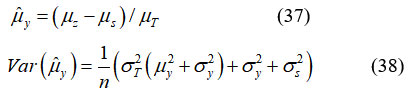
8Presented a randomization strategy that combines additive and multiplicative approaches. They believe that this combination can increase respondents' confidence regarding privacy protection because their model takes into account two scrambling variables, S and T. The observed responses based on this model are provided by:

They also assumed that E(T) = uT =1
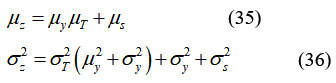
The unbiased estimator uy
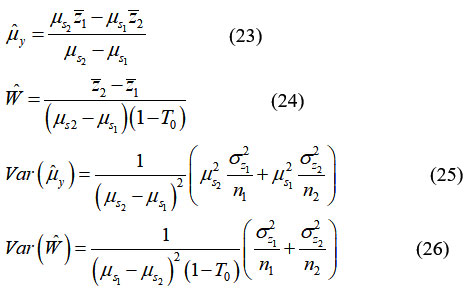
20Proposed a three stage additive optional RRT model with two scrambling variables Si (i = 1,2)

The mean and variance of Z are

The unbiased estimator for uy
.jpg)
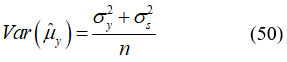
When gathering data on a quantitatively sensitive variable for the purpose of estimating the population mean, 17 took into consideration the subtractive randomized response technique (RRT) model. The model asks respondents to deduct the value of their random or scrambled variable (S) from a known distribution from the true value of the sensitive response or true response. As indicated by Z, Y is the observed/scrambled response and is provided by:

The scrambled variable S is distributed independently of the sensitive variable Y, whose mean uS = 0
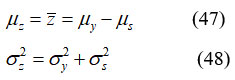
If Z1, Z2,....., Zn

The variance of uy
Following their analysis of the quantitative model put forth by 10, 22 proposed an optional scrambling model. The observed responses can be expressed as:
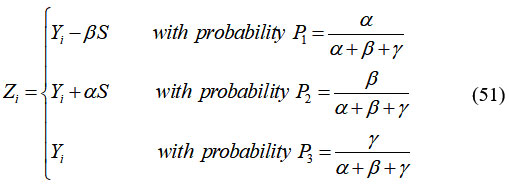
Where a, B
An estimator for uy
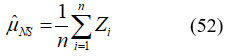
The variance of uNS

Four randomized response models were compared by 2 in order to extract sensitive information. The models are provided by

An expression for the unbiased estimator is
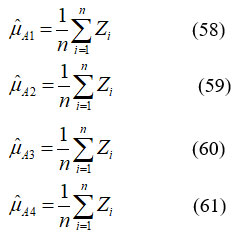
The variance expressions at E(S) = 0 = 0
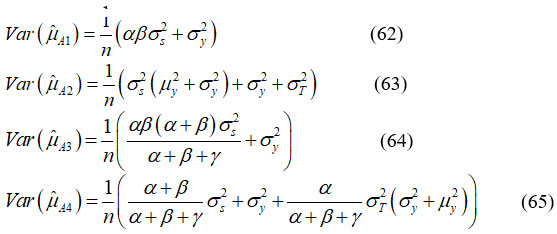
Comparing the likelihoods found in 22 with those found in 13. For the study variable that is sensitive, the mean estimator is provided by
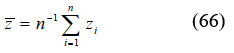
The Variance of Z

Some Existing Randomized Response Estimators with Auxiliary Information
In order to obtain information about Y indirectly,25 employed the additive model and presented the ratio method of estimation as:
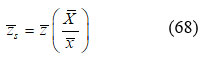
The mean square error of Zs

In order to obtain information about Y indirectly, 30 employed the additive model and presented the exponential ratio estimation method as:
.jpg)

Materials and Methods
Proposed Estimator for Sensitive Study Variable
In this segment, we modified and suggested the estimator created by 1 when sensitive study variables were present, along with alternative estimator classes as

The general form of the estimators (3.2) through (3.8) is as follows:

Where, i = 1, 2, 3, 4, 5, 6, 7
Applying the relative definitions from section one to (3.2) and (3.9), we get
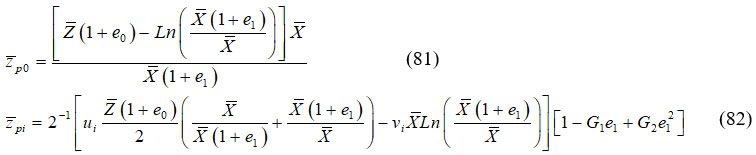
By streamlining 3.10 and 3.11, we arrive at (3.12) and (3.13).

Subtracting Z


Differentiating (3.8) with respect to ui
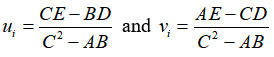
Efficiency Comparisons
Provided certain conditions are met, the suggested estimators outperform estimators found in the literature.
.jpg)
Results and Discussion
This section presents empirical investigations that were carried out using three data sets to show how well the suggested estimators performed in comparison to some existing ones.
Population 1: [Source: 32]

Population 2: [Source: 32]

Population 3: [Source: 32]

Table 1: MSE of proposed estimator and the existing ones using the populations
Estimators | Population 1 | Population 2 | Population 3 |
Z | 1.315067 | 9.767367 | 0.5378535 |
Zs | 0.9657649 | 7.426973 | 0.4187068 |
Zsh | 1.00627 | 8.468694 | 0.4722927 |
Zp0 | 0.96566587 | 7.417854 | 0.3896769 |
Zp1 | 0.294805 | 5.449369 | 0.1054512 |
Zp2 | 0.294805 | 5.449369 | 0.1054512 |
Zp3 | 0.294805 | 5.449369 | 0.1054512 |
Zp4 | 0.294805 | 5.449369 | 0.1054512 |
Zp5 | 0.09347122 | 2.772475 | 0.0713895 |
Zp6 | 0.09347122 | 2.772475 | 0.0713895 |
Zp7 | 0.02633714 | 1.880148 | 0.0599886 |
Table 2: PRE of proposed estimator and the existing ones using the populations
Estimators | Population 1 | Population 2 | Population 3 |
Z | 100 | 100 | 100 |
Zs | 136.17 | 131.51 | 128.46 |
Zsh | 119.98 | 113.34 | 113.88 |
Zp0 | 136.18 | 131.67 | 138.03 |
Zp1 | 446.08 | 179.24 | 510.05 |
Zp2 | 446.08 | 179.24 | 510.05 |
Zp3 | 446.08 | 179.24 | 510.05 |
Zp4 | 446.08 | 179.24 | 510.05 |
Zp5 | 1406.92 | 353.30 | 753.41 |
Zp6 | 1406.92 | 353.30 | 753.41 |
Zp7 | 4993.21 | 518.50 | 896.59 |
Using the three data sets, Tables 1 and 2 present the empirical results of the MSE and PRE of the suggested and current estimators. The suggested estimators exhibit lower PRE and minimum MSE across all populations. This illustrates how the highly efficient estimators that have been suggested can yield more accurate population mean estimates when sensitive surveys are present than the estimators that have been taken into consideration in this study.
Conclusion
In this work, we proposed several log-type mean estimators for research variables that are sensitive, and we computed the mean square errors of these estimators. Based on the empirical results, the proposed estimators were seen to be more effective than the alternatives considered for this investigation. Accordingly, in situations where a sensitive issue is present, the suggested estimators ought to be applied when estimating the population mean.
Acknowledgment
The authors would like to thank Statistics Department of Usman Danfodiyo University for the successful completion of this research.
Funding Sources
The author(s) received no financial support for the research, authorship and publication of this article.
Conflict of Interest
The authors declare no conflict of interest.
Data Availability Statement
This statement does not apply to this article
Ethics Statement
This research did not involve human participants, animal subjects, or any material that requires ethical approval.
Authors' Contribution
Each author mentioned has significantly and directly contributed intellectually to the project and has given their approval for its publication.
M.A (Yunusa) conceptualization, methodology, writing-orginal draft.
A. (Awwal) data collection analysis, writing-review and editing.
References
- Adejumobi A., Yunusa M. A., Erinola Y. A. and Abubakar K. An efficient logarithmic ratio type estimator of finite population mean under simple random sampling. International Journal of Engineering and Applied Physics. Vol. 3(2), pp. 700-705, (2023).
- Azeem, M., Shabbir, J., Salahuddin, N., Hussain, S. and Salam, A. (2023) A comparative study of randomized response techniques using separate and combined metrics of efficiency and privacy. PLOS ONE, 19(1), 24-42. (2023).
- Audu A., Gidado A., Dauran N. S., Buda S., Abdulazeez S. A. and Yunusa M. A. On the efficiency of modified regression-type estimators using robust regression and non-conventional measures of dispersion. Asian research journal of Mathematics, 18 (2), 1-26. (2022).
CrossRef - Audu A., Gidado A., Dauran N.S., Buda S., Abdulazeez S. A., Yunusa M.A. and Abubakar I. Modified robust regression type estimators with multi-auxiliary variables using Non-conventional measures of dispersion. Nigerian Journal of Basic and Applied Sciences, 31 (1), 08-25. (2023).
CrossRef - Bahl S. and Tuteja R.K. Ratio and product type exponential estimators. Information and Optimization Sciences, 12 (1), 159-163. (1991)
CrossRef - Bar-Lev S.K., Bobovitch E. and Bouka B. A note on randomized response models for quantitative data, Metrika, 60, 255-260. (2004).
CrossRef - Cochran W.G. The estimation of the yields of cereal experiments by sampling for the ratio grain to total produce. Journal of Agriculture Society, 30, 262-275. (1940).
CrossRef - Diana G. and Perri P.F. New scrambled response models for estimating the mean of a sensitive quantitative character. Journal of Applied Statistics, 37(11), 1875-1890. (2010).
CrossRef - Eichhorn B.H. and Hayre L.S. Scrambled randomized response methods for obtaining sensitive quantitative data. Journal of Statistical Planning and inference, 7(4), 307-316. (1983).
CrossRef - Gjestvang C.R. and Singh S. An improved randomized response model: Estimation of mean. Journal of Applied Statistics, 36(12), 1361-1367. (2009)
CrossRef - Grover L.K. and Kaur P. An improved exponential type estimator of population mean of sensitive variable using optional randomized response technique. Pakistan journal of Statistics and operation research, 15(1), 49-59. (2019).
CrossRef - Grover L.K. and Kaur P. An improved estimator of the finite population mean in simple random sampling. Models Assisted Statistics and Application, 6(1), 47-55. (2011).
CrossRef - Gupta S., Gupta B. and Singh S. Estimation of sensitivity level of personal interview survey questions. Journal of Statistical Planning and Inference, 100(2), 239-247. (2002).
CrossRef - Gupta S., Thornton B., Shabbir J. and Singhal S. A comparison of multiplicative and additive optional RRT models. Journal Statistical theory and application, 5(3), 226-239. (2006).
- Gupta S., Shabbir J. and Sehra S. Mean and sensitivity estimation in optional randomized response models. Journal of Statistical Planning and inference, 14(110), 2870-2874. (2010).
CrossRef - Huang K.C. Unbiased estimators of mean, variance and sensitivity level for quantitative characteristics in finite population sampling, Metrika, 71, 341-352. (2010).
CrossRef - Hussain Z. Improvement of the Gupta and Thornton scrambling model through double use of randomization device. International journal Academic Research Business and Social Sciences, 291-297. (2012).
- Kadilar C. and Cingi H. Ratio estimators in simple random sampling. Applied Mathematics and Computation, 151, 893-902. (2006).
CrossRef - Koyuncu N., Gupta S. and Sousa R. Exponential type estimators of the mean of a sensitive variable in the presence of non-sensitive auxiliary information. Communication in Statistics-Simulation and Computation, 43(7), 1583-1594. (2010).
CrossRef - Mehta S., Dass B.K., Shabbir J. and Gupta S. A third stage optional randomized response model. Journal of Statistical theory and Practice, 6(3), 412-427. (2012).
CrossRef - Murthy M.N. Product method of estimation. The Indian journal of Statistics, 26(1), 69-74. (1964).
- Narjis G. and Shabbir J. An efficient new scrambled response model for estimating sensitive population mean in successive sampling. Communications in Statistics-Simulation and Computation, 1-18. (2021).
CrossRef - Patidar P. and Singh H.P. An improved class of estimators of population mean of sensitive variable using optional randomized response technique. Pakistan journal of Statistics and operation research, 19(3), 537-550. (2023).
CrossRef - Pollock K.H. and Bek Y. A comparison of three randomized response models for quantitative data. Journal of American Statistical Application, 71, 884-886. (1976).
CrossRef - Sousa R., Shabbir J., Real P.C. and Gupta S. Ratio estimation of the mean of a sensitive variable in the presence of auxiliary information. Journal of Statistics theory and Practice, 4(3), 495-507. (2010).
CrossRef - Singh H.P. and Mathur N. Estimation of population mean when coefficient of variation is known using scrambled response technique. Journal of Statistical Planning and inference, 131,144. (2005).
CrossRef - Singh H.P. and Tailor R. Use of known correlation coefficient in estimating the finite population mean. Statistics in Transition, 6, 555-560. (2003).
- Sahai A. A simple randomized response technique in complex surveys, Metron, 65, 59-66. (2007).
- Sisodia B.V.S. and Dwivedi V.K. A modified ratio estimator using coefficient of variation of auxiliary variable. Journal of Indian Society Agricultural Statistics, 33, 13-18. (1981).
- Shahzad U., Hanif M., Koyuncu N. and Luengo A.V.G. A new family of estimators for mean estimation alongside the sensitivity issues. Journal of reliability and Statistical Studies, 10(2), 43-63. (2017).
- Tarray T.A. and Singh H.P. A simple way of improving the Bar-Lev, Bobovitch and Boukai randomized response model. Kuwait Journal of Science, 44(4), 83-90. (2017).
- Tiwari K.K., Bhougal S., Kumar S. and Rather K.U. Using randomized response to estimate the population mean of a sensitive variable under measurement error. Journal of Statistical Theory and Practice, 16-28. (2022).
CrossRef - Upadhyaya L.N. and Singh H.P. Use of transformed auxiliary variable in estimating the finite population mean. Biometrical journal, 41, 627-636. (1991).
CrossRef - Warner S.L. Randomized response: A survey technique for eliminating evasive answer bias. Journal of the American Statistical Association, 60(309), 63-69. (1965).
CrossRef - Warner S.L. The linear randomized response model. Journal of the American Statistical Association, 66(336), 884-888. (1971).
CrossRef - Yunusa M.A., Audu A., Ishaq O.O. and Beki D.O. An efficient exponential type estimator for estimating finite population mean under simple random sampling. Annals Computer Science Series, 19 (1), 46-51. (2021).

This work is licensed under a Creative Commons Attribution 4.0 International License.