
Improved Modified Classes of Regression Type Estimators of Finite Population Mean in the Presence of Auxiliary Attribute
Awwal Adejumobi1*  , Mojeed Abiodun Yunusa2 and Ahmed Audu2
1Department of Mathematics, Kebbi State University of Science and Technology, Aliero, Nigeria .
2Department of Statistics, Usmanu Danfodiyo University, Sokoto, Nigeria .
http://dx.doi.org/10.13005/OJPS07.01.07
Copy the following to cite this article:
Adejumobi A, Yunusa M. A, Audu A. Improved Modified Classes of Regression Type Estimators of Finite Population Mean in the Presence of Auxiliary Attribute. Oriental Jornal of Physical Sciences 2021; 7(1). DOI:http://dx.doi.org/10.13005/OJPS07.01.07
Copy the following to cite this URL:
Adejumobi A, Yunusa M. A, Audu A. Improved Modified Classes of Regression Type Estimators of Finite Population Mean in the Presence of Auxiliary Attribute. Oriental Jornal of Physical Sciences 2021; 7(1). Available From: https://bit.ly/3AwW3eN
Download article (pdf) Citation Manager Publish History



Introduction
In sampling theory, auxiliary information is used to increase the precision of estimate of an estimator when there is correlation between response variable y and auxiliary variable x. Authors have suggested different estimators note varying renowned parameters of an auxiliary information. In probability sampling, it is well confirmed that auxiliary variable may be qualitative form, such variable is term auxiliary attribute. Many authors in literature have suggested estimators using auxiliary variable, they include Cochran1 who developed the ratio estimator to investigate problem of estimation of the population mean when auxiliary variable is present. Other researchers that developed estimators using auxiliary information include: : Audu et al. 1, Tailor et al. 11, Singh 6,7, Kadilar and Cingi 3, Khoshnevisan et al.5, Perri 5, Yunusa et al.12, Singh and Kumar 8.
When the auxiliary information are qualitative in nature, that is, auxiliary information in the form of attribute, such as colour of hair of individuals and their weight can be regarded as auxiliary attribute and study variable, sex and height of women in a locality may be regarded as auxiliary attribute and study variable etc. Several authors have developed estimators in this direction like Singh et al. 9,10, Zaman13 and Zaman and Kadilar14.
Currently in this research, we have intended efficient regression type estimators of finite population mean, that gives precise estimate for the size of finite population mean in the presence of auxiliary attribute when the bi-serial correlation between study variable and auxiliary attribute is weak.
Materials and Methods
Sample mean ym of simple random sampling is given as

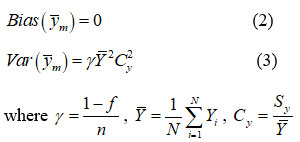
Bias and variance of ym is given by
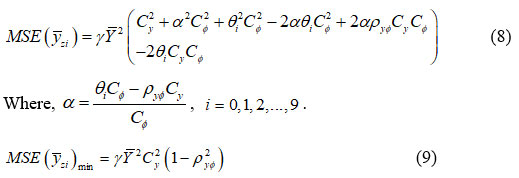
Zaman and Kadilar 14 class of exponential ratio type estimators in the presence of auxiliary attribute as:

Bias and mean square error of the estimator yzk are given by

Zaman13, an improved class of estimator for the estimation of population mean as

The MSE of the estimator is
Audu et al. 1 modified class of estimators for the population mean of the study variable in the presence of auxiliary attribute as
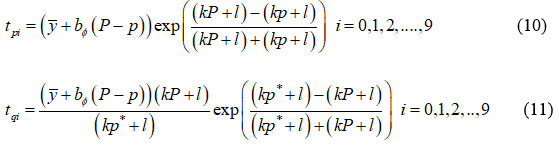
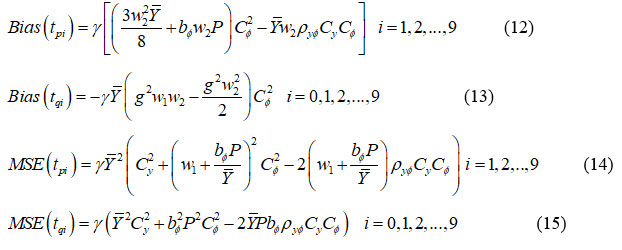
bias and mean square error of the estimator tpi and tqi are given by

Suggested Estimators
By exploiting the idea of Audu et al.1 and other estimators in literature, finite population mean based on the presence of auxiliary attribute for estimation of population mean of study variable are proposed
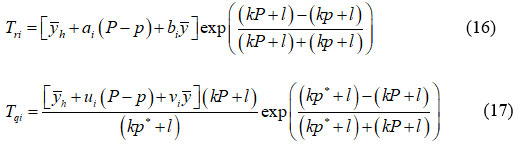

ai, bi, ui and vi are invariable to be determined, I =1,2,……..,..10 . The suggested estimators will be defined if and only if ai ≠ 0, bi ≠ 0, ui ≠ 0, vi ≠ 0, and yh ≠ 0. The estimator was obtained by incorporating unknowns into the estimators and taken the sample mean in the estimators of Audu et al.1 as the average of the exponential ratio and product type estimators.
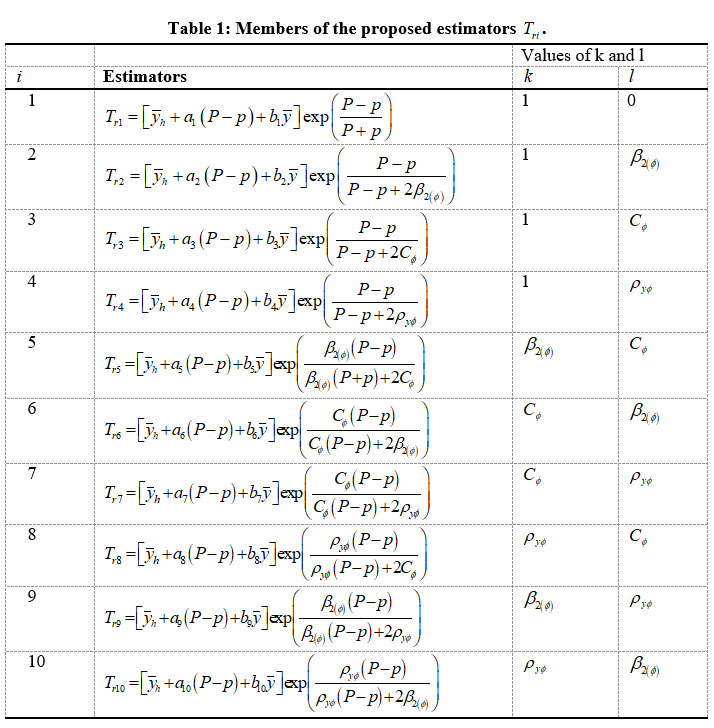 |
Table 1: Members of the proposed estimators Tri . Click here to view Table |
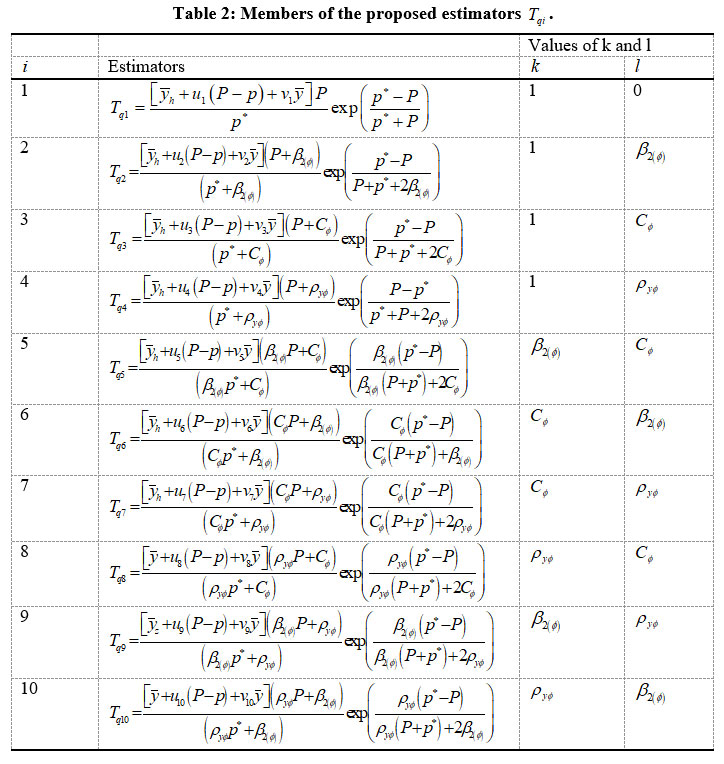 |
Table 2: Members of the proposed estimators Tqi. Click here to view Table |
To obtain the biases and MSEs of Tri and Tqi , the following error terms are defined as
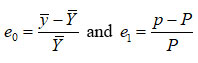
Such that


Expressing (16) and (17) in terms of error terms, we have
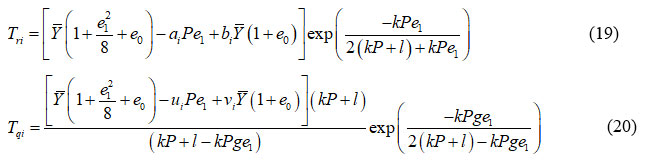
Simplify (19) and (20), then obtained
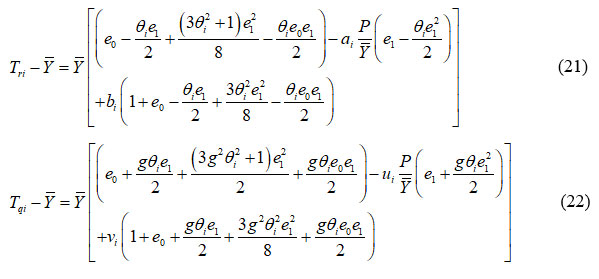
Where, θi = kP / (kP +l), i =1,2,…..,10.
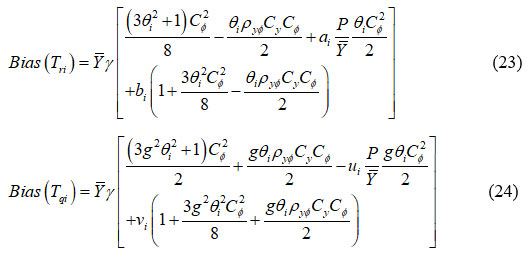
Taking expectation of (21) and (22) and apply the results of (18) to obtain the biases of the Tri and Tqi as
Squaring and taking expectation of (21) and (22) and apply the results of (18) to obtain the MSE of proposed estimators asTri and Tqi as
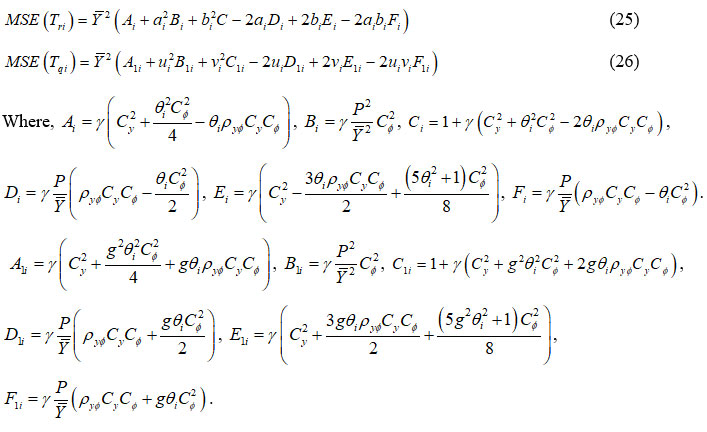
Differentiating (25) with respect to ai and bi, equate to zero and solve for ai and bi simultaneously, we obtain
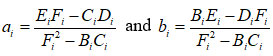
Substituting the results in (25), we obtained the minimum MSE of Tri as

Differentiating (26) with respect to ui and vi, equate to zero and solve for ui and vi simultaneously, we obtain

Substituting the results in (26), we obtained the minimum MSE of Tqi as

Efficiency Comparisons
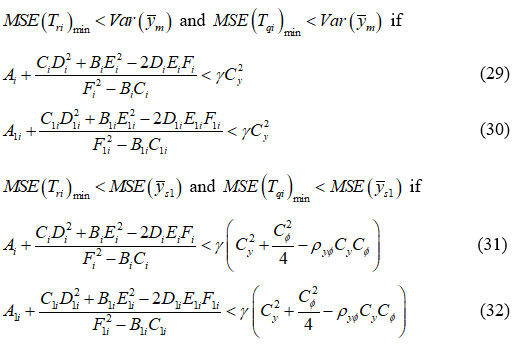
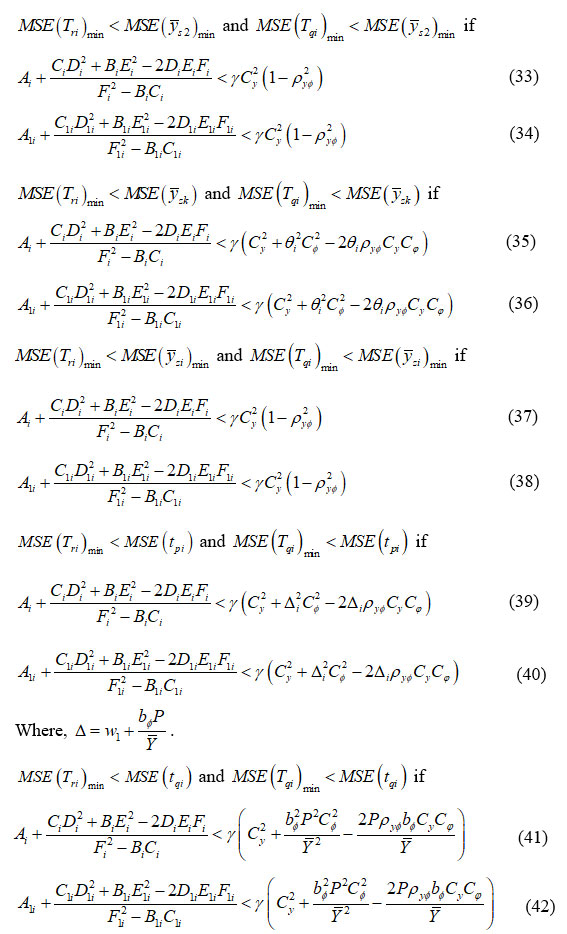
The suggested estimators Tri and Tqi are more efficient than

tpi and tqi, if the following condition are satisfied
Empirical Study
In this section, the suggested estimators Tri and Tqi performance are assessed with that of the sample mean ym , Audu et al. [1] estimators, tpi and tqi numerically considering two natural populations used as:
Population 1: Zaman [13]

N = 89, n = 20, ? = 3.3596, P = 0.1236, β2(Ø) =3.492, Cy = 0.6008, CØ =2.6779, pyØ = 0.766,
Population 2: Zaman [13]

N = 111, n = 30, ? = 29.279, P = 0.117, β2(Ø) =3.898, Cy = 0.872, CØ =2.758, pyØ = 0.797,
Table 3: MSEs and PREs of suggested estimators and existing ones using population 1
|
Estimators |
MSE |
PRE |
Estimators |
MSE |
PRE |
|
Sample mean estimator |
ym |
0.1579298 |
100.00 |
||
|
Audu et al. [1] Estimators |
|||||
|
tp1 |
0.0661802 |
238.636 |
tp2 |
0.06679036 |
236.456 |
|
tp3 |
0.08040544 |
196.4168 |
tp4 |
0.08037597 |
196.4888 |
|
tp5 |
0.07114321 |
221.9886 |
tp6 |
0.1366728 |
115.5532 |
|
tp7 |
0.0661782 |
238.6432 |
tp8 |
0.167143 |
94.48783 |
|
tp9 |
0.06581011 |
239.978 |
tqi |
0.06526354 |
241.9878 |
|
Suggested Estimators |
|||||
|
Tr1 |
0.001670981 |
9451.3223 |
Tq1 |
0.044078 |
358.2962 |
|
Tr2 |
0.0467923 |
337.5124 |
Tq2 |
0.04682617 |
337.2682 |
|
Tr3 |
0.04676769 |
337.6900 |
Tq3 |
0.0468241 |
337.2832 |
|
Tr4 |
0.04621405 |
341.7355 |
Tq4 |
0.04677797 |
337.6158 |
|
Tr5 |
0.04621526 |
341.7265 |
Tq5 |
0.04677807 |
337.6150 |
|
Tr6 |
0.04659158 |
338.9664 |
Tq6 |
0.04680936 |
337.3894 |
|
Tr7 |
0.04383939 |
360.2463 |
Tq7 |
0.04658672 |
339.0018 |
|
Tr8 |
0.0467924 |
337.5116 |
Tq8 |
0.04682618 |
337.2682 |
|
Tr9 |
0.04245525 |
371.6411 |
Tq9 |
0.04648274 |
339.7601 |
|
Tr10 |
0.04680724 |
337.4046 |
Tq10 |
0.04682742 |
337.2592 |
Table 4: MSEs and PREs of suggested estimators and existing ones using population 2.
|
Estimators |
MSE |
PRE |
Estimators |
MSE |
PRE |
|
Sample mean estimator |
ym |
15.85573 |
100.00 |
||
|
Audu et al. [1] Estimators |
|||||
|
tp1 |
5.817701 |
272.5429 |
tp2 |
5.849699 |
271.0521 |
|
tp3 |
6.4338 |
246.4443 |
tp4 |
6.582441 |
240.8792 |
|
tp5 |
6.015808 |
263.5678 |
tp6 |
9.077466 |
174.6713 |
|
tp7 |
5.826441 |
272.1341 |
tp8 |
11.03681 |
143.6623 |
|
tp9 |
5.805672 |
273.1076 |
tq1 |
5.784028 |
274.1296 |
|
Suggested Estimators |
|||||
|
Tr1 |
3.39183 |
467.4683 |
|
4.854043 |
326.6500 |
|
Tr2 |
5.023029 |
315.6607 |
Tq1 |
5.023891 |
315.6066 |
|
Tr3 |
5.022078 |
315.7205 |
Tq2 |
5.023761 |
315.6147 |
|
Tr4 |
5.004624 |
316.8216 |
Tq3 |
5.021381 |
315.7643 |
|
Tr5 |
5.000151 |
317.1050 |
Tq4 |
5.020775 |
315.8024 |
|
Tr6 |
5.017135 |
316.0316 |
Tq5 |
5.023085 |
315.6572 |
|
Tr7 |
4.9231 |
322.0645 |
Tq6 |
5.010563 |
316.4461 |
|
Tr8 |
5.022769 |
315.6771 |
Tq7 |
5.023856 |
315.6088 |
|
Tr9 |
4.86016 |
326.2388 |
Tq8 |
5.002496 |
316.9564 |
|
Tr10 |
5.023386 |
315.6383 |
Tq10 |
5.02394 |
315.6035 |
Table 3 and 4 show the Mean Square Errors and Percentage Relative Efficiencies of the sample mean, ym , Audu et al. [1], tpi and tqi , and suggested estimators, Tri and Tqi estimators, considering two data sets respectively. The results revealed that the suggested estimators Tri and Tqi have minimum MSEs and higher PREs as compared to the sample mean, Audu et al.[1] estimators.
Results and Discussion
An improved classes of regression type estimators of finite population mean are suggested. Table 3 shows MSEs and PREs of the suggested and some existing estimators using dataset 1. The result shows that the suggested estimators have minimum MSEs and higher PREs compared to the conventional estimators and Audu et al. [1] estimators. Table 4 shows MSEs and PREs of the suggested and some existing estimators using dataset 2. The result shows that the suggested estimators have minimum MSEs and higher PREs compared to the conventional estimators and Audu et al. [1] estimators.
Conclusion
In this research, we proposed an improved modified regression estimators for the estimation of population mean in the presence of auxiliary attribute. The results of the empirical study revealed that the proposed estimators are more efficient than sample mean and Audu et al. [1] estimators. This implies that the proposed estimators have great chance of producing precise estimate.
Acknowledgment
The authors are profoundly grateful to the editors for the corrections and guidance made on this research.
Conflict of Interest
The authors declare no conflict of interest
Funding Sources
The authors received no financial support for the research, authorship and publication of this article.
References
- Audu A., Abdulazeez S.A., Danbaba A., Ahijjo Y.M., Gidado A. and Yunusa M.A., Modified Classes of Regression-type Estimators of Population Mean in the presence of Auxiliary Attribute. Asian Research Journal of Mathematics; 18(1): 65-89. DOI: 10.9734/ARJOM/2022/v18i130355, (2022).
CrossRef - Cochran W.G., Sampling techniques. New York, NY: John Wiley and Sons. (1977).
- Kadilar C. and Cingi H. A., New estimator using two auxiliary variables. Applied Mathematics and Computation; 16(2): 901–908, (2005).
CrossRef - Khoshnevisan M., Singh R., Chauhan P., Sawan N. and Smarandache F. A., General family of estimators for estimating population mean using known value of some population parameter(s). Far East Journal of Theoretical Statistics; 22(2): 181–191, (2007).
- Perri P.F., Improved ratio-cum-product type estimators. Statist Trans; 8(2): 51- 69, (2007).
- Singh M.P., On the estimation of ratio and product of the population parameters. Sankhya B; 2(7): 231-328, (1965).
- Singh M.P., Ratio cum product method of estimation. Metrika; 1(2): 34–42, (1967)
CrossRef - Singh R. and Kumar M. A., Note on transformations on auxiliary variable in survey sampling. MASA; 6(1): 17-19, (2011).
CrossRef - Singh R., Chauhan P., Sawan N. and Smarandache F., Auxiliary information and a priori values in construction of improved estimators. Renaissance High Press. DOI: 10.9734/AJPAS/2021/v14i230323, (2007).
CrossRef - Singh R., Chauhan P. and Sawan N., Ratio-product type exponential for estimating finite population mean using information on auxiliary attribute. Journal of Statistics and Management Systems; 81(7): 679-1067, (2013).
- Tailor R., Chouhan S. and Garg N., A ratio-cum-product estimator of population mean in stratified random sampling using two auxiliary variables. STATISTICA, anno LXXII; 3, (2012).
CrossRef - Yunusa M.A., Audu A., Musa N., Beki D.O., Rashida A., Bello A.B. and Hairullahi M.U., Logarithmic ratio-type estimator of population coefficient of variation. Asian Journal of Probability and Statistics; 14(2): 13-22, (2021).
CrossRef - Zaman T., Generalized exponential estimators for the finite population mean. Statistics in transition; 21(1): 159-168, (2020).
CrossRef - Zaman T. and Kadilar C., Novel family of exponential estimators using information of auxiliary attribute. Journal of Statistics and Management Systems; 34(7): 978-1078,(2019).

This work is licensed under a Creative Commons Attribution 4.0 International License.