Determination of Noise Level in Some Selected Major Markets Within Obio/Akpor Local Government Area
Orlunta Aloysius Ndubisi*  and Mamah Ifeyinwa Miriam
1Department of Science Laboratory Technology, School of Science and Technology, Port Harcourt Polytechnic, Rumuola, Port Harcourt, Rivers .
http://dx.doi.org/10.13005/OJPS10.01.13
Noise is an environmental pollutant and can lead to some adverse health effects in humans. The noise levels in some selected major markets in Obio/Akpor Local Government Area has been analysed using the KKMOON sound level meter (GM135) to measure the noise levels. The global positioning system (GPS) was used to record the various geographical coordinates of the sample points. The noise levels were evaluated in a total of 10 selected markets. In each of the markets, a total of five sample points were measured giving an overall of 50 sample points for the 10 markets. The computed average noise levels for the 10 sample locations varied from 70.92 dB to 82.28 dB with an overall average of 76.154 dB. The measured noise levels and the computed average levels are all below the recommended safe limit of 90. 0 dB by the World Health Organization (WHO) and 85.0 dB by the Federal Environmental Protection Agency (FEPA). These noise levels obtained indicate that people who do business within these markets are not exposed to any health hazard associated with noise levels above the ambient level. However, routine monitoring of the noise levels is recommended within these markets.
Copy the following to cite this article:
Ndubisi O. A, Miriam M. I. Determination of Noise Level in Some Selected Major Markets Within Obio/Akpor Local Government Area. Oriental Jornal of Physical Sciences 2025; 10(1).
DOI:http://dx.doi.org/10.13005/OJPS10.01.13Copy the following to cite this URL:
Ndubisi O. A, Miriam M. I. Determination of Noise Level in Some Selected Major Markets Within Obio/Akpor Local Government Area. Oriental Jornal of Physical Sciences 2025; 10(1).Avialable here:https://bit.ly/4133He5
Download article (pdf) Citation Manager Publish History


Introduction
Noise can be explained as an undesirable sound especially above ambient levels in an environment. Noise generation in the environment is growing at an unacceptable level as a result of the increase in human activities1.Generally, the world population is increasing geometrically and this accounts for the proportional increase in environmental pollution. Pollution is the presences of unwanted substance in any part of the environment which most of the time are generated by humans due to its everyday activities. These generated pollutants are usually discharged into the environment as by – products.
Some sources of noise pollutions are; natural sources, biological sources and artificial sources.
The natural sources involve those sources of noise which ordinarily cannot be avoided and are inevitable 2. These sources includes high speed wind, thunder storm, hurricanes, gales, earthquakes, high intensity rainfall, hail storms, waterfalls, etc.
Another sources of noise pollution is the biological and includes noise from wild and tamed animals, such noise involves roars of lions and barking of street dogs. It also involves sounds created and generated by humans such as shouting, laughing, singing, weeping and quarrelling.
The artificial sources of noise pollution in the environment are the sounds generated due to man’s activities, and may arise from industries, automobiles, railway locomotive engines, construction works, aircraft, musical instruments, factories, loudspeakers and other domestic appliances. The health effects of these noise levels cannot be measured cumulatively 3.
The health effect of noise pollution on humans cannot be overemphasized. They may include annoyance, sleep interference, auditory impairments, speech interference and psychological effects 4.
Auditory impairments may involve the damages done to hearing mechanism due to exposure to higher noise levels. The speech interference is the non-audibility of a person’s speech as a result of environmental noise pollution.
Environmental noise pollution can lead to some psychological effects such as changes in the behavior of some individuals and animals. Some of these behavioral changes include annoyance, irritation, weakness. These changes in behavior could result in poor output, reduced efficiency and lead to errors. It can also affect the speech by reducing its intelligibility 5.
It is estimated that about 5% of the children in developing countries are affected by some levels of speech inadequacies due to exposure to noise above ambient levels 5,6. Annoyance and irritation are usually caused by high frequency noise levels. Also sounds of very greater intensity can cause mental imbalances. Some Neurotic individuals are more sensitive to noise level 6. Noise levels below 85.0 dBA decibels are usually said to be free from noise pollution while the levels above this value are regarded to be unsafe 7.
Higher noise levels can reduce the quality of good sleep and affect the overall mental and physical health of an individual. The intensity of noise level at night is estimated to be at the range of about 40 dBA and can result to sleep disturbance 8. Noise intensities at the range of 50dBA to 60dBA can affect the center of the brain and lead to change of normal sleep patter and distort deep sleep 6.
Materials and Methods
Materials
The KK Moon sound level meter (GM1352) was used for recording the noise level in the study sites. The KK Moon sound level meter (GM1352) has SPL, Leq, Lmax, Lmin and SEL measurement. It is very simple to operate and is an ideal and essential tool for noise measurement and data collection in the field. It has a wide measurement range and a host of features and linear weighting.
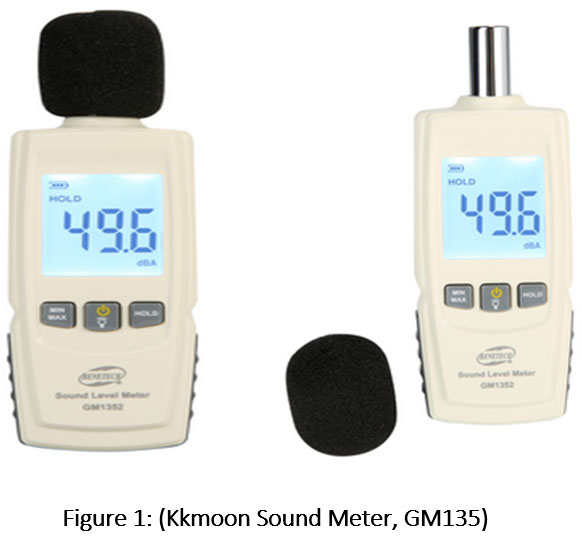 | Figure 1: (Kkmoon Sound Meter, GM135)
|
Method
The KK Moon sound level meter (GM1352) is a hand – held instrument. At each sampling point, the instrument was raised to a height of about 50cm above the ground level. The noise levels were measured at five different sampling points for each location at a considerable distance away from the preceding measurement. The analysis of results used in generating our results was the Statistical Package for the Social Sciences (SPSS). The expression for the mean value of the measured noise levels within the sample locations is given in equation (1). The computed mean noise values are expressed in unit of Decibel (dBA).
Results and Discussion
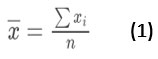
The mean of the measured Noise levels in the various sample locations indicate that in Rumuola market the noise level varied from 70.1-74.9 dB, with an average of 71.92 dB, Rumuokwuta market, the noise levels varied from 73.6-79.6 dB with an average of 76.8 dB , in Rumuigbo market the noise level ranged from 63.3-104.4 dB with a computed average of 81.9 dB, the noise levels in Rumuokoro market varied from 69.0-81.9 dB, with an average of 76.88 dB , Wimpey market ranged from 71.4-90.9 dB with an average of 76.86 dB , Junction market changed from 67.4-74.7 dB ,with an average of 70.92 dB , the noise levels at Iwofe market ranged from 80.7-90.3 dB , with an average of 82.28 dB , the noise level at Ozuoba market ranged from 72.0-93.7 dB, at Choba market, the noise level varied from 72.0-93.7 dB , within average of 76.82 dB , while the noise levels from Rukpokwu market ranged from 70.9-75.8 with an average of 70.72 dB . All these values obtained indicate that Iwofe market has the highest average noise level of 82.28 dB and this can be attributed the high presence of milling machines within the market.
Table 1: Result From Market Analyses
S/N | Name of Market | Latt | Long | 1st Reading | 2nd Reading | 3rd Reading | 4th Reading | 5th Reading | Average Reading |
(N) | (E) | dBA | dBA | dBA | dBA | dBA | dBA | ||
1 | Rumuola | 4.83158 | 7.00437 | 70.2 | 70.1 | 70.1 | 74.9 | 74.3 | 71.92 |
2 | Rumuokwuta | 4.83998 | 6.98591 | 78.6 | 77.9 | 74.2 | 73.6 | 79.7 | 76.80 |
3 | Rumuigbo | 4.8396 | 6.98705 | 63.3 | 85.6 | 77.9 | 104.4 | 78.3 | 81.90 |
4 | Rumuokoro | 4.84745 | 6.99042 | 81.9 | 83.3 | 69.0 | 72.7 | 77.5 | 76.88 |
5 | Wimpy | 4.84958 | 6.79493 | 71.4 | 76.6 | 73.0 | 72.4 | 90.9 | 76.86 |
6 | Market Junction | 4.83391 | 6.79493 | 67.4 | 72.6 | 68.6 | 74.7 | 71.3 | 70.92 |
7 | Ozuoba | 4.87416 | 6.92984 | 86.9 | 79.5 | 74.2 | 73.9 | 67.7 | 76.44 |
8 | Iwofe | 4.82014 | 6.95487 | 74.6 | 81.0 | 84.8 | 80.7 | 90.3 | 82.28 |
9 | Choba | 4.89247 | 6.90057 | 72.0 | 72.2 | 93.7 | 69.1 | 77.1 | 76.82 |
10 | Rukpokwu | 4.90153 | 7.00103 | 70.9 | 75.8 | 63.1 | 72.1 | 71.7 | 70.72 |
 | Figure 2: Chart Showing Average Noise Level of Selected markets
|
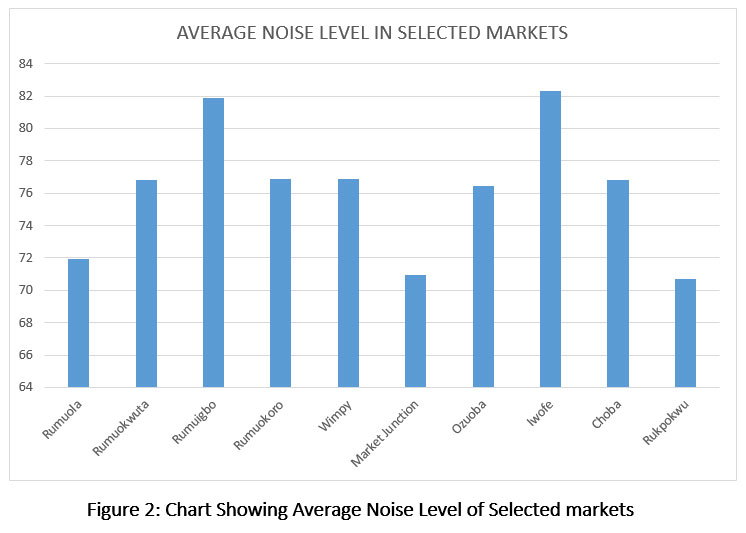
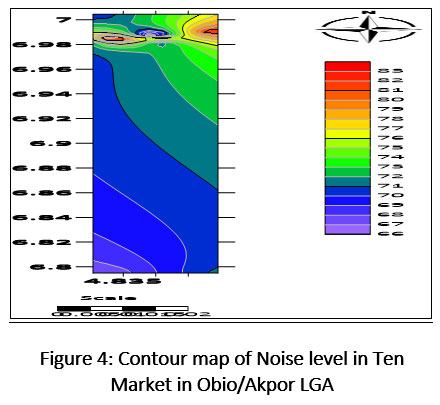
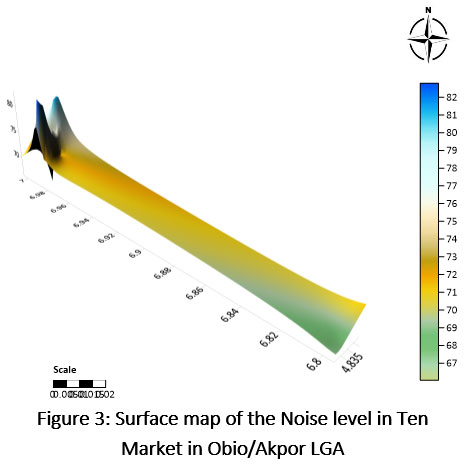 | Figure 3: Surface map of the Noise level in Ten Market in Obio/Akpor LGA
|
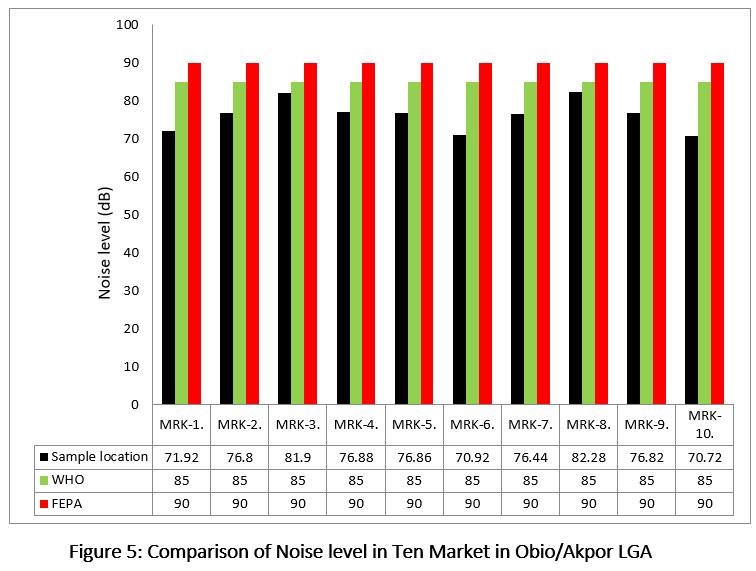 | Figure 5: Comparison of Noise level in Ten Market in Obio/Akpor LGA
|
A similar work 9. on the assessment of Noise Pollution in wurukum and North Bank Areas of Markurdi, Benue State measured Noise level which varied from 50.7 -84.4 dB. Also, another work 10 on level of Sound Exposure in Residential and Peace Zones of Kathmandu measured
Noise levels which varied from 62.4-71.88 dB. These measured Noise Levels agree with the Noise Levels measured in this work.
All these measured Noise levels are within the recommended safe limit by WHO of 90.0 dB and 85.0 dB respectively. Therefore, those who do business in these markets may not be in danger of any health hazard from due to exposure to higher Noise level above ambient level.
Conclusion
The KK Moon sound level meter (GM1352) meter was used to obtain the noise levels in the 10 selected markets within Obio/Akpor Local Government Area. It provides a database on the noise level within these markets.
While some readings from some parts of the market has shown significantly low level of noise (63.1dBA – 63.3dBA), some other parts of the markets has shown significantly higher noise levels. However, the mean noise levels obtained for each market are all below the set standards of 85dBA Federal Environmental Protection Agency of Nigeria (FEPA) and 90dBA by the World Health Organization (WHO) (11-12).
Acknowledgement
We wish to thank the Obio/Akpor Local Government Council for granting us the permission to our research measurements within the major markets in council area.
Also, we wish to express our profound gratitude to all the market authorities for their cooperation and understanding throughout the period this research work lasted.
We also wish to thank the head of department of Science Laboratory Technology, Port Harcourt Polytechnics for her support and understanding throughout the period we were carrying out this research work.
Funding Sources
The research work is self-funded, there were no aside sources of income.
Conflict of Interest
There are no conflicts of interest in this research work.
Data Availability Statement
All the database produced in this research work are contained in the manuscript.
Ethics Statement
This research work did not involve the experiment on any humans or animals.
Author Contributions
Orlunta Aloysius Ndubisi: provided the theoretical background and carried out the field work
Mamah, Ifeyinwa Miriam: assisted in the data analysis and the interpretation of the results.
Reference
- Aftab T, Bashir F, Shafiq T. Road Traffic Noise Pollution Hazard. Bangladesh Journal of Science and Industrial. 2007;42(4):435-440.
CrossRef - Piccolo A, Plutino D, Cannistraro G. Evaluation and Analysis of the Environmental Noise of Messina, Italy, Applied Acoustics. 2004;1-19.
- Pelumi, E.O, Hilary I.O, Omoleye A.O, Oluwole O.O. A Study of Noise Pollution Measurements and Possible Effects on Public Health in Ata Metropolis, Nigeria. Journal of Open Access Mecedonian, Medical Sciences. 2019;7(8):1391-1395.
CrossRef - Atmaca E, Peker I, Altin A. Industrial Noise and Its Effects on Humans. Polish Journal of Environmental Studies 2005;14(6):721-726.
CrossRef - Godson E. E, Ana D. G, Shendell G. E, Brown M. K. C. Assessment of Noise and Associated Health Impacts at Selected Secondary Schools in Ibadan, Nigeria. Journal of Environmental and Public Health, 2009;ID739502:1-6.
CrossRef - Islam K, Ahmad T, Shaikh G.H. Traffic Noise in Lahore City, Part I: Road Traffic Noise. Pakistan Journal of Science and Industrial Research., 2004;47(5):340-344.
- Joshua Y.G, Onoja S, Jatau. R. Y. Evaluation of Noise Level in Selected Markets in Jos-North, Plateau State, Nigeria. International Journal of Research in environmental Science. 2020;6(3):27-35.
- Vanadeep K, Krishnaiah. M, Variation of Ambient Noise Quality at Residential Areas with Different Living Environs in and Around Tirupati. Indian J. Environ. & Ecoplan. 2011;18(2 - 3):192 – 209.
- Assessment of levels of Noise Pollution at Wurukum and North Bank Areas of Makurki, Benue State, Nigeria. Trends Applied Sci. Res.2020;15(1):45-53
CrossRef - Priyanka C., Rajeev J, Alima M, Padam J, Siddhant J. Sound Level Exposure in the Residential and Peace Zones of Kathmandu Valley and its Effects on Human Health. Journal of Scientific Reports in Life Sciences. 2022;3(4):27-52 (Agarwal, 2005).
- Federal Environmental Protection Agency (FEPA). National Interim Guidelines and Standards for Industrial Effluent, gaseous emission and Hazardous waste in Nigeria. 1991.
- World Health Organization (WHO) Occupational noise: assessing the burden of disease from work-related hearing impairment at national and local levels. Environmental Burden of Disease Series, 9: World Health Organization, Switzerland. 2005.

This work is licensed under a Creative Commons Attribution 4.0 International License.