
Investigation of a rubidium Fast ionic Conductor [Cu2HgI4:0.xRbI] where (x = 0.1, 0.2 and 0.3 mol. wt. %)
Noorussaba * and A. Ahmad Ahmad
1Solid State Chemistry Lab, Department of Chemistry, Aligarh- 202002, India, Aligarh Muslim University, Aligarh, 202002 U.P India .
http://dx.doi.org/10.13005/OJPS02.02.07
An investigation has been taken for the development of new Rb+ ion conducting composite fast ionic systems, [Cu2HgI4:0.xRbI](where x = 0.1, 0.2 and 0.3 mol. wt. %), were synthesized, using [Cu2HgI4] ternary composite system as the host. [Cu2HgI4] compound belongs to the fast ion conductors of A2BX4 (A = Cu, B = Hg and X = I). The compounds [Cu2HgI4] phase changes near 388 K as the crystal lattice changes from a tetragonal to a hexagonal structure. Near 445K, [Cu2HgI4] is replaced by an equilibrium mixture of α-CuI and HgI2. At each of these phase transition, ionic conductivity increases by an order of magnitude or more. The substitution of Hg++ from Cu+ in [Cu2HgI4]is accompanied by a slight increase in the room temperature conductivity, as a result of either increased crystalline defects or an increased Rb+ substitution also characterized. FTIR, FAR-IR, SEM and EDAX analyses were performed to confirm the formation of fast ion conductors [Cu2HgI4:0.xRbI] (where x = 0.1, 0.2 and 0.3 mol. wt. %).
Copy the following to cite this article:
Noorussaba, Ahmad A. Investigation of a rubidium Fast ionic Conductor [Cu2HgI4:0.xRbI] where (x = 0.1, 0.2 and 0.3 mol. wt. %). Orient J Phys Sciences 2017;2(1).
DOI:http://dx.doi.org/10.13005/OJPS02.02.07Copy the following to cite this URL:
Noorussaba, Ahmad A. Investigation of a rubidium Fast ionic Conductor [Cu2HgI4:0.xRbI] where (x = 0.1, 0.2 and 0.3 mol. wt. %). Orient J Phys Sciences 2017;2(1). Available from: https://bit.ly/3pQZFjo
Download article (pdf) Citation Manager Publish History
Introduction
Solid state sciences have exerted a broader impact on newer areas of science and technology, as evidenced by the rapid growth of this field during the last quarter century [1]. The solid electrolytes M2NI4 (M = Cu; N = Hg) undergoes a phase transition at particular temperatures [2]. This similar small group of solids, also known as solid electrolytes, has a particular ion which is not confirmed to specified lattice sites but especially free to move throughout the three dimensional structures [3]. Solid composites have composed as a good system of multiphase ionic composite materials for developing solid state fast ionic devices [4, 5, 6]. Copper mercury iodide Cu2HgI4, is unique amongst the fast-ionic conductors having a tetragonal unit cell that has an order-disorder phase transition at approximately 76°C, above which α-phase shows mixed ionic and electronic conductivity. The stable β-phase of Cu2HgI4, which is not fastionic, under encompassing conditions is tetragonal with space group . The iodine atoms adopt a some distorted face centered cubic (fcc) arrangement and the cations occupy 3/8 of the tetrahedrally coordinated positions in an ordered manner derived from the chalcopyrite (M2NI4) structure by the accumulation of cation vacancies. Upon heating, the first fast-ionic α-phase appears at 473K. The structure of α-Cu2HgI4 is similar to that of the β-phase, except that the iodine sublattice is an ideal ffc arrangement. Crystallography displays that α-Cu2HgI4 is in the cubic space group with each cation site having an average occupancy of ½ Cu and ¼ Hg-2. Rietveld refinements of the diffraction data shows the lattice parameters as a = 6.0672Å and c = 12.2266Å at room temperature [7]. Chemical substitution has been used extensively to modify either the magnitude of ionic conductivity or the transition temperature separating fast-ionic and covalent phases in various solid electrolytes [8-14].
This paper shows our investigation on the synthesis, and characterization of Rb+ cation substituted [Cu2HgI4]. In, the present investigation, Although the initial purpose of this work is to see cations (i.e. Rb+) effect by introducing in Cu2HgI4 systems, we find that it is quit difficult to see this and instead we find the structure of pure Cu2HgI4 systems is different from iodide fast ionic system leading to the phase separation structure.
Series of Samples:
e.g. 1) [Cu2HgI4:xRbI] -
a) [Cu2HgI4]
b) [Cu2HgI4:1RbI]
c) [Cu2HgI4:2RbI]
d) [Cu2HgI4:3RbI] M2NI4 (M = Cu; N = Hg
In the [M2NI4] where (M = Cu; N = Hg) systems [M2NI4] are pure materials, In [M2NI4:xRbI] composite system (where x = 0.1- 0.3 mol. wt. %, M = Cu; N = Hg), [M2NI4] considered as host doped with [0.xRbI] (where x = 1, 2, 3 mol. wt. %) as the dopant. The composition of the host [M2NI4] was kept constant in all the composite samples of [M2NI4:xRbI]. It has been observed that a much better solid electrolyte composite system can be prepared with the host [M2NI4] (M = Cu; N = Hg) systems [15].
Experimental Procedure
Material
The materials were used as received; copper [ІІ] iodide and mercury [ІІ] iodide were of S.d.fine-chem India, and C.D.H. Analar, each of which possessed a purity of 99%, 99% respectively.
Preparation and characterization of pure and doped samples
Preparation of pure [Cu2HgI4] host sample
Cu2HgI4 was synthesized through carrying out the reaction of a stoichiometric mixture of the component binary halides CuI and HgI2 according to the equation:
2CuI + HgI2 → Cu2HgI4 (5)
Firstly, the powdery raw materials were mixed well. Then the fine pulverized stoichiometric mixture of the binary components was vacuum-packed in a silica crucible and was placed in an air oven (CE 0434 NSW-144) at a temperature of approximately 200°C for 24 hours. Finally, the mixture was then cooled rapidly down to room temperature (removal from furnace at 200°C). After cooling, the dark red color changed to maroon. Cu2HgI4 is dark red below 76°C and maroon after 76°C [16].
Preparation of doped sample [Cu2HgI4:0.xRbI]
To form [Cu2HgI4:xRbI] composite compound, [Cu2HgI4] host was doped with RbI in various x = 0.1 - 0.3 mol. wt. % respectively in an agate mortar. It was synthesized through solid state reaction. Silver tetra-iodocadmiate 02 mol. wt. % [Cu2HgI4] were mixed with x = 0.1- 0.3 mol. wt. % (RbI) dopant solid respectively in an agate mortar, to form [Cu2HgI4:0.xRbI] fast ion conductor at room temperature. They were then heated at 100°C (373K) for 24 hrs in a silica crucible. After intermittent grinding, all the samples were finally prepared [17].
Characterization of [Cu2HgI4:0.xRbI] composite fast ion conductor
Scanning Electron Microscopic (SEM), Energy Dispersive Spectral (EDAX), FTIR spectral analysis were utilized to prepare and investigate the new composite fast ion conductors [Cu2HgI4:0.xRbI].
Scanning electron microscopic (SEM) studies
The scanning electron microscopic (SEM) studies were conducted to get information regarding samples surface topography and composition of all the fast ionic composite systems [Cu2HgI4:xRbI] (where x = 0.1- 0.3 mol. wt. % respectively). Afterwards, the reaction was accomplished using Jeol JSM 6510LV Scanning Electron Microscope at room temperature and different magnifications (at 3000x and 10,000x).
Energy dispersive spectral (EDAX) Studies
A chemical analysis of [Cu2HgI4:0.xRbI] (where x = 0.1- 0.3 mol. wt. %) was conducted. The processed samples were carried out by EDAX to determine if there is any deviation from the initial composition. Fig. 4 shows a typical EDAX result for [Cu2HgI4:0.xRbI] sample.
Far-IR Spectral Analysis
The Far-IR spectrum was recorded for all the fast ionic composite systems [Cu2HgI4:xRbI] (where x = 0.1 - 0.3 mol. wt. %) in the far-infrared range 30-400 cm-1 at room temperature using a Perkin Elmer/FTIR Spectrometer measured in KBr.
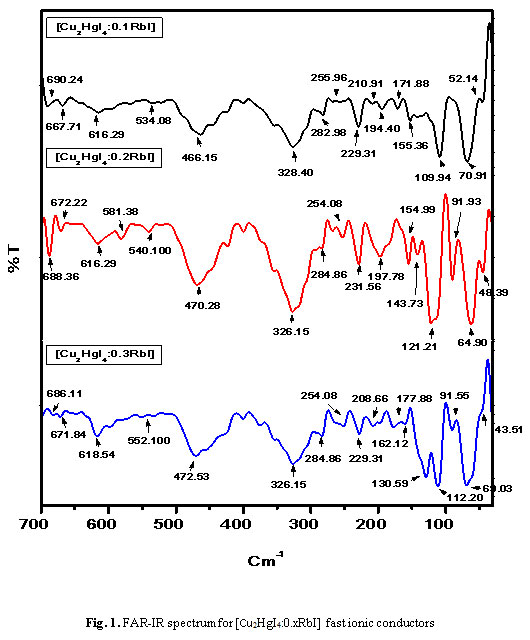 |
Figure 1 |
Results and Discussion
FTIR analysis
FAR-IR discussion in [Cu2HgI4:0.xRbI]
Figure 1 shows IR spectrum of the vapour over solid [Cu2HgI4:0.xRbI] (where x = 0.1- 0.3 mol. wt. %) in the 30-700 cm-1 region at room temperature.
The IR spectrum of [Cu2HgI4:0.xRbI] (where x = 0.1- 0.3 mol. wt. %) solid at room temperature showed two distinct absorption bands. The fundamental Cu-I stretching frequency of the monomer is assigned to the absorption around 109.94
cm-1, 121.21 cm-1, 112.20 cm-1 in x = 0.1- 0.3 mol. wt. % which shows typical PR band structure of a diatomic molecule. The (CuI)2 dimeric molecule can be assigned to the band origin at 70.91 cm-1, 91.93 cm-1 and 91.55 cm-1 in x = 0.1- 0.3 mol. wt. % respectively [24]. Dimeric molecules are present in a considerable amount in the vapour formed over CuI at the temperature used in the present experiments by IR-measurements.
Rittners electrostatic model [19] considered a square planar structure (D2h symmetry) as the most stable arrangement for (CuI)2 based on Ionic model calculations. This square planar structure allows three of the total six normal modes of vibration to be IR active. The stretching modes e.g. B2u and B3v involve high frequency in plane motion, and the bending mode e.g. B1u involves lower frequency out of plane motion. On the basis of these consideration, the peak at ca 70.91 cm-1, 91.93 cm-1 and 91.55 cm-1 in x = 0.1- 0.3 mol. wt. % is present due to the stretching motion and the peak at ca 52.14, 48.39 and 43.51 in x = 0.1- 0.3 mol. wt. % is present due to the bending motion of the (CuI)2 molecule. There is, however, no clear argument for the assignment of the observed stretching band to the B2u and B3v mode [19].
The spectrum of [Cu2HgI4:0.xRbI] (where x = 0.1- 0.3 mol. wt. %) solid consisted two strong absorption bands that are listed in Table 1. It is concluded that HgI2 molecular species are responsible for both of the peaks. The linear structure of the HgI2 molecule (D∞h symmetry), as established by electron diffraction measurements [20-22], allows two of the three fundamental frequencies to be infrared active and hence, the assignment is straight forward: the symmetric Hg-I stretching frequency ᶹ3 at 229.31, 231.56, 229.31 cm-1 in x = 0.1- 0.3 mol. wt. % and I-Hg-I blending frequency ᶹ2 at 155.36, 154.99, 162.12 cm-1 in x = 0.1- 0.3 mol. wt. %.
Rotational spectrum of H2O impurities shows the additional sharp lines in the spectrum. [Cu2HgI4:0.xRbI] (where x = 0.1- 0.3 mol. wt. %) solid composite, also shows three distinct absorption bands at 328.40, 466.15 and 616.29 cm-1, in x = 0.1, 326.15, 470.28 and 616.29 cm-1, in x = 0.2, 326.15, 472.53 and 618.56 cm-1, in x = 0.3 in their IR spectrum. Above 400 cm-1, the position of the absorption bands is in excellent agreement with those of the [Cu2HgI4] molecules [23]. On further increasing the wavenumber, the intensity of the peaks decreases, owing to condensation of HgI2 in the colder parts of the optical cell, these bands corresponds to those CuI and indicate the presence of CuI and (HgI2)2 molecules.
In spite of all the above peaks, numerous sharp absorption bands of the rotational spectrum of [Cu2HgI4:0.xRbI] (where x = 0.1- 0.3 mol. wt. %) were present, which were at 534.08, 667.71, 690.24 cm-1, in x = 0.1, 540.10, 581.38, 672.22, 688.38 cm-1 in x = 0.2, 552.10, 671.84 and 686.11cm-1 in x = 0.3 mol. wt. %. These absorption bands are in excellent agreement with those of the [Cu2HgI4] host composite. Another additional peaks that might indicate the presence of Rbl species is at 210.91, 255.96 in x = 0.1, 197.78, 254.08 cm-1 in x = 0.2, 208.66, 254.08 cm-1 in x = 0.3 mol. wt. % have been observed shows Rb-I stretch of the molecule.
These results show that the successive release of HgI2 and CuI/(HgI2)2 vapour species occurs during heating, thus indicating the dissociation of [Cu2HgI4:0.xRbI] (where x = 0.1- 0.3 mol. wt. %) molecules under the conditions of the experiments (Table 1). Additional peaks that might indicate the presence of Cu-Hg-I species have been observed.
Scanning Electron Microscopic (SEM) Studies
The scanning electron microscopic (SEM) studies were conducted to gain insight about samples surface topography and composition of all the fast ionic composite systems [Cu2HgI4:xRbI] (where x = 0.1- 0.3 mol. wt. %) after the reaction was completed (sintered) at room temperature. Fig. 3. shows typical results at two different magnifications (at 3000x and 10,000x), that confirms the highly accumulated nature of particles. The average size of accumulated particles is 0.825–1.164 μm. It is worth noting here that the accumulation hence achieved is more evident at higher magnification. (Fig. 4b). Moreover, there is a major possibility of existence of nanosize amorphous particles. The sintering temperature of all the samples cannot be high enough to synthesize the pure phase of monoclinic [Cu2HgI4:xRbI] (x = 0.1- 0.3 mol. wt. %) sample as indicated by FTIR. The SEM images shown in Fig. 3 suggest that the particles of all the samples are covered with a slice of RbI, sintered at a particular temperature. These slices are attributed to the residual RbI particles left over from the solid state reaction method [24]. The residual RbI particles can favor stabilization of Hg2+ and facilitate the diffusion of Cu+. As it is evident, it is the result of Cu2HgI4 decomposition during preheating and sintering process, which then produces a composite powder [Cu2HgI4:xRbI] (x = 0.1- 0.3 mol. wt. %) with superior conductivity [25].
However, the particular temperature (100 ºC) preparation causes an abrupt growth of particles with a smooth surface particle of ≈ 0.825–1.164. It has been reported that the morphology and surface area of the obtained particles bear a notable effect on the electrochemical performance of [Cu2HgI4:xRbI] (x = 0.1- 0.3 mol. wt. %). Optimizing particle size or introducing conducting additives can improve the performance, as nanometer size of RbI particles can be dispersed uniformely between [Cu2HgI4] particles. It proves to be advantageous when it comes to attaining samples bearing small and uniform particle size as well as enhancing the general conductivity of the sample. Furthermore, the solid state reaction method can check agglomeration of the particles
EDAX
EDAX analysis of [Cu2HgI4:0.xRbI] (where x = 0.1- 0.3 mol. wt. %) processed samples was conducted by EDAX to determine whether there is a aberration from the initial composition or not. In a [Cu2HgI4:0.xRbI] (where x = 0.1- 0.3 mol. wt. %) samples shows a typical EDAX result, the wt. % of the four elements (Cu = 19.21%, Hg= 10.88%, Rb = 6.79%, I = 63.13%) in a [Cu2HgI4:0.1RbI], whereas the wt. % of the four elements (Cu = 23.05%, Hg = 12.75%, Rb = 1.75%, I = 62.45%) and (Cu= 27.27%, Hg = 8.45%, Rb = 0.95%, I = 63.32%) in a x = 0.2 and 0.3 respectively, is nearly same as in the unprocessed (Cu = 20%, Hg = 13%, Rb = 7%, I = 65%) material. Therefore, it can be concluded that the composition of the samples is not modified by the formation of all the fast ion conductors by solid state reaction [27, 28].
Conclusion
A novel composite superionic systems [Cu2HgI4:0.xRbI] (where x = 0.1- 0.3 mol. wt. %), were investigated. An alternative ternary system [Cu2HgI4] was used as host. In the host [Cu2HgI4] structure, doping Rb+ in the host was found to prompt a decrease in the mobile charge carriers, Rb+ ions, which are in proportion with the increased 0.x mol. wt. % (x = 0.1- 0.3 mol. wt. %) in the host mixed system.
The formation of a superionic phase in the composite system was confirmed by several FAR-IR, SEM and EDX studies.
Acknowledgements
The authors are grateful to UGC New Delhi for financial assistance as UGC-PDF Women Scientist Scheme. The authors, with gratitude, also acknowledge the Chairman of the Department of Chemistry for providing the research facilities.
References
- J. A. Hedvall, “Reactions Fahigkeit, Fester Stoffe ‘Photolithoprint Reproduction”, (Edwards Brothers Inc., Ann, Arbor., Michigan), (1963) 67.
- Khalid Siraj, Rafiuddin, Effect of cation substitution on the conductivity of Cu2CdI4, European Journal of Scientific Research, Vol 50, No 2 (2011), pp 187-190.
- U. M. Gundusharma and E. A. Secco, Can. J. Chem, 65, 1205 (1987).
- M. A. Shah and Afaq Ahmad, A new positive mixed anion effect on fast Ag+ ion conductivity in Ag2WO4, Indian Journal of Chemistry, Vol. 39, September 2000, pp. 997-999.
- J. Maier, in: A.L. Laskar, S. Chandra (Eds.), Superionic Solids and Solid Electrolytes—Recent Trends, Academic Press, New York, 1989, p. 137.
- S. Chandra, Superionic Solids—Principles and Applications, North Holland, Amsterdam, 1981.
- S. Hull, D. A. Keen, J. Phys. Conden. Mat. 12 (2000) 3751.
- R. B. Beeken, T. J. Wright, T. Sakuma, J. Appl. Phys. 85 (1999) 7635.
- R. B. Beeken, K.L Menningen, J. Appl. Phys., 66 (1989) 5340.
- M. E. Kettai, J.P. Malugani, R. Mercier, M. Tachez, Solid State Ionics 20 (1986) 87.
- T. Sakuma, H. Fujishita, S. Hoshino, J. Phys. Soc. Jpn 51 (1982) 2628.
- K. Shahi J. B. Wagner, Jr. Phys. Rev., B 23 (1981) 6417.
- R. B. Beeken, E. M. B eeken, Solid State Ionics 136-137 (2000) 263.
- R. B. Beeken, W.L. Jetzer, D.R. Smith, Solid State Ionics 70-71 (1994) 176.
- Noorussaba and A. Ahmad, Anal. Bioanal. Electrochem., 2011, 3, 261-278.
- Noorussaba, Afaq Ahmad, Bull. Mater. Sci., 33, 2010, 419-425.
- R. B. Beeken, J. C. Faludi, W. M. Scheier, J. M. Tritz, Sol. Stat. lonics, 2002, 154, 719.
- V.P. Glushko, L.V. Gurvich, G.A. Bergman, I.V. Veits, V.A. Medvedev, G.A. Khachkuruzov and V.S. Yungman, Termodinamicheskie Svoista Individual nykh Veshchestv, Vol Ó€V, Nauka, Moskow, 1982.
- B.T. Gowda and S.W. Benson, J. Chem. Soc., Faraday Trans. 2, 79, (1983) 663.
- P.A. Akashin and V.P. Spiridonov, Kristallographia, 2 (1957) 472.
- M.W. Listen and L.E. Sutton, Trans. Faraday Soc., 37 (1941) 406.
- O. Hassel and L.C. Stromme, Z. Phys. Chem., 38 (1938) 466.
- R. Viswanathan and K. Hilpert, Ber. Bunsenges. Phys. Chem., 83 (1984) 125.
- H. W. Zandbergen, The crystal structure of
![[alpha]](file:///C:\Users\Dell\AppData\Local\Temp\msohtmlclip1\01\clip_image001.gif) -thallium hexaiodochromate, -Tl4CrI6, Acta Cryst. B., 35 (1979), pp. 2852-2855.
-thallium hexaiodochromate, -Tl4CrI6, Acta Cryst. B., 35 (1979), pp. 2852-2855. - A.V.Franiv, O.S.Kushnir, I.S.Girnyk,V.A.Franiv, I.Kityk, M. Piasecki and K.J.Plucinski, Growth and optical anisotropy of Tl4CdI6 single crystals, Ukr. J. Opt, 14, 2013, pp. 6-13.
- D. S. Kalyagin, Yu. E.Ermolenko and Yu. G.Vlasov, Diffusion of Tl-204 isotope and ionic conductivity in Tl4 HgI6 membrane material for chemical sensors, Rus. J. appld Chem., 81 (2008), pp. 2172-2174.
- A. Viswanathan, S. Austin Suthanthiraraj, Impedance and modulus spectroscopic studies on the fast ion conducting system CuI-Ag2MoO4,, Solid State Ionics, 62, 1–2 (1993), pp. 79-83
- E. Kartini, T. Sakuma, K. Basar, M. Ihsan, Mixed cation effect on silver–lithium solid electrolyte (AgI)0.5(LiPO3)0.5, Sol. Stat. Ionics 179 (2008), pp. 706–711.

This work is licensed under a Creative Commons Attribution 4.0 International License.