Qualitative and Quantitative Determination of Hydroquinone Content in Skin Whitening Cosmetics Sold in Lafia-Nigeria
U. A. Augustine*  , T. M. Akpomie , M. S. Abubakar and A. S. Onipede
1Department of Chemistry, Federal University of Lafia, Nasarawa, Nigeria .
http://dx.doi.org/10.13005/OJPS09.01.10
Hydroquinone (HQ) is a whitening or therapeutic constituent in many cosmetic products, but only allowable at a very low concentration. The abuse of HQ via frequent and prolonged usage can lead to health issues such as damage to skin and the sensitive area on the face. In Nigeria, National Agency for Food and Drug Administration and Control (NAFDAC) on its cosmetic products prohibition of bleaching agents regulations 2019, stated that no cosmetic products should contain more than 2 % of HQ alone or 1 % in combination with other lightening ingredients. This study aimed at qualitative and quantitative determination of HQ content in selected skin whitening cosmetics sold in Lafia. A total of twenty-four (24) various skin bleaching cosmetics were sampled from Lafia modern market. Thin Layer Chromatography (TLC) and uv/visible spectrophotometry were used for qualitative (identification) and quantitative (quantitation) determination of their HQ concentration, respectively. Ethanol (96 %) was used to extract HQ, and then TLC analysis at two different laboratories. At the two laboratories,nine samples (same) out of 24 were found to contain hydroquinone. The uv/visible spectrophotometric analysis indicated that the concentration of hydroquinone ranged from 0.99 % to 1.47 % in the cosmetic products studied.This study revealed that some of the products were labelled free from HQ or not labelled, and yet contained HQ, unknown to the consumers. In general, percentage hydroquinone in all the samples was less than 2 % maximum permissible limit recommended by US FDA and NAFDAC.
Copy the following to cite this article:
Augustine U. A, Akpomie T. M, Abubakar M. S, Onipede A. S. Qualitative and Quantitative Determination of Hydroquinone Content in Skin Whitening Cosmetics Sold in Lafia-Nigeria. Oriental Jornal of Physical Sciences 2024; 9(1).
DOI:http://dx.doi.org/10.13005/OJPS09.01.10Copy the following to cite this URL:
Augustine U. A, Akpomie T. M, Abubakar M. S, Onipede A. S. Qualitative and Quantitative Determination of Hydroquinone Content in Skin Whitening Cosmetics Sold in Lafia-Nigeria. Oriental Jornal of Physical Sciences 2024; 9(1). Available here: https://bit.ly/4ajrV5V
Download article (pdf) Citation Manager Publish History


Introduction
Melanocytes cells are present at the base of the epidermis, which produces melanin; an essential dark pigment of macro molecules, which is made through series of chemical reactions catalyzed by enzymes.1 This process is called melanogenesis and it increase after exposing skin to UV light, making it to physically(visibly) tan.2 Melanogenesis to protect the hypodermis from the DNA photo damage, and the initial step of this process is the oxidation of tyrosine to dopaquinone; a step catalyzed by tyrosinase.2 A chronic skin disorders that result in brownish facial pigmentation known as melasina is said to occur due to abnormal accumulation of melanin on the skin.3 Tyrosinase is an enzyme that is instrumental for melanin synthesis, therefore, tyrosinase inhibitors applied as whitening or anti-hyper pigment agents are capable of suppressing dermal melanin production.4
Body care products are those various health and hygiene products ranging from dental care products, moisturizers, essential oil, shaving products, body creams, body lotions, face gels, body oils to body cleansing products.5The use of such products could be an alarming time bomb which demands an appropriate attention towards its application on the human skin.6A series of skin lightening (bleaching) cosmetics and toiletries are currently in use by various members of the community with an intention to bleach the colour of skin that is darker; a practice brought about by racial prejudice; arising from the misunderstanding that fair skin is superior to dark, and that an individual with dark skin is less attractive or fair skin favoured over those with dark skin.7
Hydroquinone being an aromatic organic compound of the phenol, stands as a derivative of benzene with the chemical formula C6H4 (OH)2: (benzene-1,4-diol).
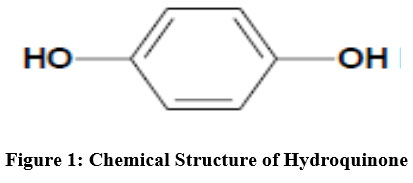 | Figure 1: Chemical Structure of Hydroquinone |
Hydroquinone naturally exists in various forms. It occurs in the leaves and barks of some berries such as blueberries and cranberries.7 Some coffee beans also contain HQ. Tea and coffee made from these berries and coffee beans, respectively will contain HQ.8 Hydroquinone can as well be extracted from different fruits, vegetables, and wheat. As a result it forms part of some wines and bears.9Industrially, HQ is manufactured in many countries for various purposes. It was immensely used for various purposes for example, apart from its application in agrochemicals and polymers; hydroquinone also serves as important reducing agent, as a photographic developer, as an anti-oxidation or stabilizer for certain materials that polymerize in the presence of free radicals, and as a chemical intermediate for the production of anti-oxidants.10,11 Hydroquinone is also used in cosmetics and medical pharmaceutical products; it prevents melanin synthesis by acting as a depigmenting agent of skin, and stops the transformation of L-3, 4- dihydroxyphenylalanine (L-DOPA) to melanin by inhibiting tyrosinase due to its structural similarity to an analog of melanin precursors.12
Hydroquinone is applied as a skin bleaching agent with a view to whiten the colour of skin.13 Hyper-pigmentation as a skin disorder could be cured with HQ products; this inhibits the activity of tyrosinase enzymes which is responsible for the initial reaction that results to melanin production.13 As a result, the content of melanin on skin decreases and skin becomes depigmented. It is conceived that HQ is the most conventional skin bleaching agent, however, chemical preparation having 2 to 4 % HQ are prescribed for the treatment of hyper-pigmentation such as melisma, chloasma and senile lentigines as well as freckles.6 However, various studies of HQ showed that it has many unfavorable side effects usually occurring due to long duration of usage. These include irritative dermatitis, melanocyte destruction, contact dermatitis and ochronosis.14 Due to its harmful side effects, the ban for the use of hydroquinone in cosmetics has been recommended.14Even though, numerous studies point out hydroquinone as a likely carcinogenic, due its association with a high occurrence of tumors in rats which had been subjected to doses of hydroquinone, including thyroid follicular cell hyperplasia, anisokaryosis, mononuclear cell/leukemia, hepatocellular adenomas, as well as renal tubule cell adenomas, it is obvious that hydroquinone is still being used in developing countries as components of some skin–lightening cosmetics.15Hydroquinone toxicity can cause serious side effects such as kidney and liver damage, nausea, abdominal pains, blood poisoning, convulsion and can even lead to coma.16All of these potentially toxic effects are possibilities with the plenty application and long term usage of HQ.17
Major adverse effects of hydroquinone include irritation in which some users may experience minor and temporary skin irritation including mild itching or stinging and reddening of the skin (irritant contact dermatitis),18 and xeroderma which is a genetic disorder in which there is a decreased ability to repair DNA damage that is caused by ultra violet (UV) light. Symptoms may include a severe sun burn after few minutes’ exposure to the sun, dry skin and changing in skin pigmentation19 as well as ochronosis, a blue-black or gray-blue discoloration. It is rare and more commonly observed in patients that use a high concentration of hydroquinone over a long period on large areas of the body. Studies also proved that hydroquinone can falsely elevate capillary glucose when measured with a glucometer.20
The formulations of hydroquinone (4 %), topical steroid and other skin lightening agents such as tretinoin (0.1 %), a zelaic acid (20 %) and kojic acid, are dermatologically used to cure acne and other pigmentary disorders such as post inflammatory hyper pigmentation and hypo pigmentation, vitiligo or melasma.17Lightening agents act mainly by inhibiting the biosynthesis of melanin.9The mechanism of hydroquinone and mercury is based on the breakdown of melanin formation by competitively blocking the activity of tyrosinase molecule.5
Hydroquinone leads to contact dermatitis, exogenous ochronosis, and dyschromia.21All products meant to lighten the skin are illegal when outside the WHO's safety regulations. These include mercury and hydroquinone which with too much and prolonged application results to poisoning, skin damage, liver and kidney malfunction. National Agency for Food and Drug Administration and Control (NAFDAC) on its cosmetic products prohibition of bleaching agents regulations 2019, stated that no person shall import, manufacture, distribute, sell, display for sale or offer for sale any cosmeticproduct in Nigeria which contains more than 2 % of hydroquinone alone or 1 % in combination with other lightening ingredients.26
Many whitening cosmetics are sold in Lafia town without the sellers and the buyers having the full knowledge of their hydroquinone content and the effects. Therefore, the aim of this study was to qualitatively and quantitatively determine hydroquinone content in some skin whitening cosmetics sold in Lafia town of Nasarawa State. And to the best of knowledge of data availability has no data on literature in Lafia.
Materials and Methods
Study Area
The investigation in this report was conducted in Lafia Modern Market. Lafia, the capital city of Nasarawa State as indicated in Figure 2 lies between latitude of 80 o 21’ 30’’ N and longitude of 89 o 30’ 20’’ E. Nasarawa state is located centrally in the middle belt region and lies between latitude 70 o 45 o and 90 o 25N of equator and between longitude 70 o and 90 o 37E of the Greenwich meridian. It shares boundary with Kaduna State in the north, Plateau State in the east, Taraba and Benue States in south, while Kogi and Federal Capital Territory flank it in the west.4
The choice of cosmetic products (creams, lotions and tubes) selected from Lafia Modern market in Lafia town, Nasarawa state was informed based on market survey within the Lafia main-market. The selected samples were said to be fast selling, commonly purchased brands and most used for skin lightening.4
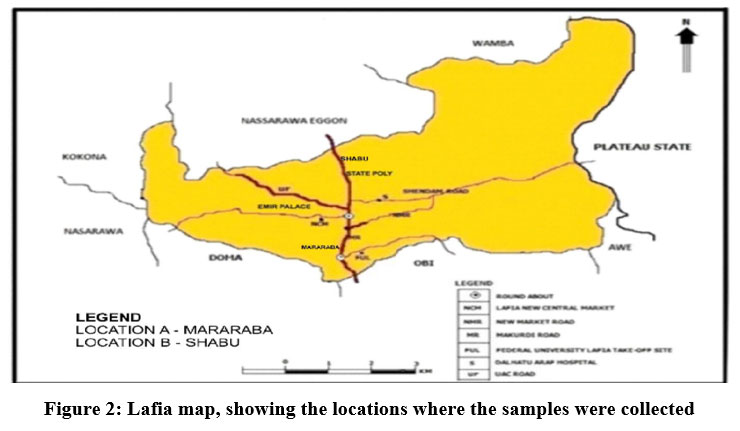 | Figure 2: Lafia map, showing the locations where the samples were collected Click here to view Figure |
Sample Collection
Twenty four (24) cosmetic products which include: 8 creams, 8 lotions and 8 tubes (gel/creams) were randomly purchased from cosmetics shops at Lafia Modern Market and were transported to the laboratory for analysis. Required information about each product was noted. These include the product name, manufacturers and their locations, batch numbers as well as productions and expiry dates.
Table 1: Samples Designation
S/N | Cosmetic Products Sample Codes | Country Produced |
1. | Cream A | Cote d’Ivoire |
2. | Cream B | Cote d’Ivoire |
3. | Cream C | Cote d’Ivoire |
4. | Cream D | Cote d’Ivoire |
5. | Cream E | Togo |
6. | Cream F | Cote d’Ivoire |
7. | Cream G | Cote d’Ivoire |
8. | Cream H | Nigeria |
9. | Lotion A | Togo |
10. | Lotion B | Togo |
11. | Lotion C | Togo |
12. | Lotion D | Togo |
13. | Lotion E | Cote d’Ivoire |
14. | Lotion F | Togo |
15. | Lotion G | Nigeria |
16. | Lotion H | Togo |
17. | Tube A (gel) | Togo |
18. | Tube B(gel) | Cote d’Ivoire |
19. | Tube C(gel) | Nigeria |
20. | Tube D(gel) | Nigeria |
21. | Tube E (cream) | Togo |
22. | Tube F (cream) | Nigeria |
23. | Tube G (cream) | Nigeria |
24. | Tube H (cream) | Nigeria |
Apparatus and Reagents
Apparatus
Volumetric flask (1000 mL), Chromatographic plate (20 x 20 cm), UV/VIS spectrophotometer- model: UV-160A, analytical weighing balance, weighing dish, spatula, and desiccator.
Reagents
Distilled water, standard hydroquinone, silica gel, ethanol, methanol, chloroform, sulphuric acid, acetone and hexane. All reagents used were of analytical grade (BDH Chemicals Ltd, Poole, England) with no further purification.
Thin Layer Chromatography (TLC) Analysis
Preparation of sample solution for TLC
Each of the skin whitening cosmetic sample was prepared by a method used by Ketkomolet al. (2019). Two grams of each sample was weighed into a 25 mL beaker. Fifteen mL of 96 % (v/v) ethanol was added and mixed on the water bath at 60 oC for 10 minutes. The mixture was cooled in an ice bath until the separation of fats took place. This was then filtered by using Whatman Filter Paper No.1. The filtrate was collected for TLC. This same procedure was used for all samples.
Preparation of standard solution
The standard solution was prepared by dissolving 0.50 g of HQ Reference Standard (RS) in small volume of 96 % (v/v) ethanol in 25 mL volumetric flask and the resulting volume was made up to the mark.22
Chromatographic method
Thin layer chromatographic plates (20 × 20 cm) were made on 0.25 mm thick silica gel (90 g, Merck, Germany). A mixture of chloroform: ethyl acetate (3:1) was used as mobile phase at Chemistry Laboratory of Federal University of Lafia, while n-hexane/acetone (3:1) and n-hexane/ethyl acetate (3:1) mobile phases were used at Pharmacognosy and Herbal Medicine Laboratory, Bayero University, Kano. The standard and duplicate of each sample solution were spotted onto the start line of the TLC plate. This was then placed into the separating jar containing mobile phase. Twenty micro litres of each sample and standard solution were deposited on plates and developed at room temperature to the height of approximate 16 cm from the start line. After drying or spraying with 0.2 % ethanolic dichlorofluorescein, the plate was visually examined under UV light at 254 nm and 366 nm, respectively.22 The Retention factor (Rf) value were calculated using the following equation:
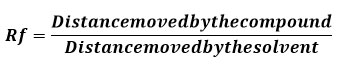
Identification of the hydroquinone in each sample was done by comparison of its Rf value with that of the standard.
Spectrophotometric Analysis of Hydroquinone Concentration (Quantitative Analysis)
The Uv/vis spectrophotometric analysis of hydroquinone concentration was conducted at Federal University of Lafia.
A 1.00 g (M.W. = 110.112 g) standard hydroquinone was dissolved in 1000 mL of 0.05 M sulphuric acid to make 1000 ppm. The concentration of hydroquinone was determined as described by Smith et al. (2009) to analyze the exact concentration of hydroquinone.
A 1.0 g of each sample was dissolved in 20 cm3 of 0.05 M sulphuric acid in a water bath. This solution was then transferred into 25 cm3 standard volumetric flask and made up to the mark with the 0.05 M sulphuric acid. The solution was then filtered with a filter paper then discarded the first 5 cm3. The filter paper was then rinsed with additional 5 cm3 of sulphuric acid to remove any retained sample. The concentration of hydroquinone was determined using a UV spectrophotometer at a wavelength of 320 nm, using quartz cuvette.
Estimation of ?max (maximum absorption of hydroquinone)
The standard solution of the prepared hydroquinone solution was scanned from 302-460 nm using Shimadzu UV-160A spectrophotometer in order to determine the maximum absorption. Wave length with the highest absorbance value was noted. The maximum wavelength (?max) was used for further quantitative spectrophotometric measurements. The absorbance of the blank (using sulphuric acid) was also taken.
Calibration curve
After determination of the maximum absorption of hydroquinone using spectrophotometer, the absorbance was then traced on the calibration curve to give the concentration of hydroquinone in each sample. The calibration curve was obtained from hydroquinone standard by serial dilutions of concentrations 10, 20, 30, 40 and 50 µg/mL. Under the optimum experimental conditions, a good linear correlation was obtained between the absorbance and hydroquinone concentration in the range from 10 to 50 ?g/mL(Table 2 and Figure 3). The measurements were carried out in triplicate to obtain a Beer Lambert’s plot. The absorbance readings of the solutions of the twenty four (24) samples were also taken at the same wavelength and the concentrations were determined from the calibration curve.
Table 2: Calibration Curve Data for Hydroquinone
Concentration of Hydroquinone (µg/mL) | Absorbance (302 nm) |
10.0 | 0.20 |
20.0 | 0.50 |
30.0 | 0.60 |
40.0 | 0.70 |
50.0 | 0.90 |
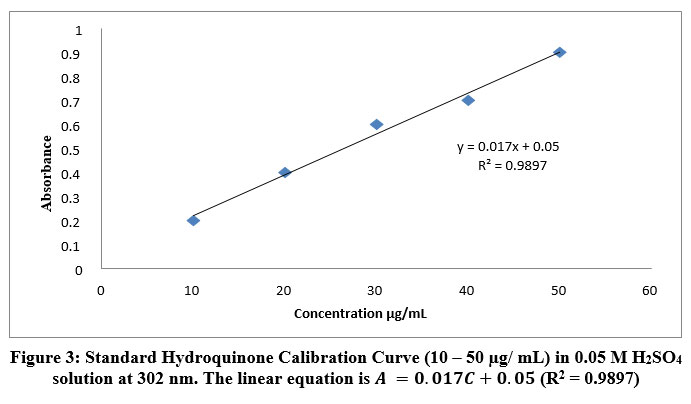 | Figure 1:Standard Hydroquinone Calibration Curve (10 – 50 µg/ mL) in 0.05 M H2SO4 solution at 302 nm. The linear equation is A =0.017C+0.05(R2 = 0.9897) Click here to view Figure |
Statistical Analysis
A descriptive statistics encompassing means and standard deviation were computed using Microsoft Office Excel 2019.
Quality Control
Samples were handled carefully to avoid contamination. This is a part of quality control measure to ensure reliability of results. Accuracy was also ensured in performing the spectrophotometric procedures and conducted in triplicate.
Results and Discussion
The results of the qualitative and quantitative determination of HQ content in selected skin whitening cosmetics sold in Lafia town, Nasarawa State are as presented in Tables 3-4 and Figure 4, respectively.
Results of Qualitative Analysis of Cosmetic Products using Chloroform and Ethyl Acetate as Developing Solvents
The presence of hydroquinone content was determined using Thin Layer Chromatography (TLC),and chloroform/ethyl acetate as developing solvent as shown in Table 1. The Rf value was compared with Rf value of the standard hydroquinone (reference hydroquinone solution) which was 0.50. When 0.2 % ethanolic dichlorofluorescein was sprayed, various spots, some of which coincided with that of the reference solution were shown. The occurrence of more than one spot in a sample indicated the presence of more than one substance in the sample. More confirmation was made by comparing the Rf values of the reference hydroquinone (0.50) with the Rf values of sample spots, which confirms the presence of hydroquinone in nine of the sampled cosmetic products and fifteen were found not to contain hydroquinone.
Based on the results obtained, Nine of the cosmetic products coded as creams A, B, C and D, lotions A, B, C and D, and tube A (gel) coincided with the Rf value of the standard hydroquinone (0.50).Rest of the fifteen sampled cosmetic products did not coincide with the Rf value of the standard hydroquinone (0.50). The results of this study were in line with the findings of Siddique et al24 and Mastore et al.1
Results of Qualitative Analysis of Cosmetic Products using n-hexane/acetone and n-hexane/ethyl acetateas Developing Solvents
The results obtained fromPharmacognosy and Herbal Medicine Laboratory, Bayero University, Kano using n-hexane/acetone and n-hexane/ethyl acetate as mobile phases were in agreement with those of Chemistry Laboratory, Federal University of Lafia. The Rf value of the standard hydroquinone (referencehydroquinone solution) from Bayero University was 0.51, almost the same with thatof Federal University of Lafia (0.50) with a negligible difference of 0.01.The Rf values of the reference hydroquinone (0.51) also coincided with the Rf values of sample spots of the same nine samples; creams A, B, C and D, lotions A, B, C and D, and tube A (gel) obtained from Federal University of Lafia. This is a further confirmation that those nine samples contained hydroquinone.
Table 3: Results of Qualitative Analysis of Cosmetic ProductsUsing Chloroform andEthyl Acetateas Developing Solvents (Chemistry laboratory, Federal university of Lafia).
S/N. | Cosmetic Products Sample Codes | Country Produced | Rf Value | Rf Value for Standard Hydroquinone |
1. | Cream A | Cote d’Ivoire | 0.50 | 0.50 |
2. | Cream B | Cote d’Ivoire | 0.50 | |
3. | Cream C | Cote d’Ivoire | 0.50 | |
4. | Cream D | Cote d’Ivoire | 0.50 | |
5. | Cream E | Togo | 0.60 | |
6. | Cream F | Cote d’Ivoire | 0.88 | |
7. | Cream G | Cote d’Ivoire | 0.67 | |
8. | Cream H | Nigeria | 0.70 | |
9. | Lotion A | Togo | 0.50 | |
10. | Lotion B | Togo | 0.50 | |
11. | Lotion C | Togo | 0.50 | |
12. | Lotion D | Togo | 0.50 | |
13. | Lotion E | Cote d’Ivoire | 0.75 | |
14. | Lotion F | Togo | 0.98 | |
15. | Lotion G | Nigeria | 0.67 | |
16. | Lotion H | Togo | 0.77 | |
17. | Tube A (gel) | Togo | 0.50 | |
18. | Tube B(gel) | Cote d’Ivoire | 0.87 | |
19. | Tube C (gel) | Nigeria | 0.94 | |
20. | Tube D (gel) | Nigeria | 0.88 | |
21. | Tube E (cream) | Togo | 0.75 | |
22. | Tube F (cream) | Nigeria | 0.68 | |
23. | Tube G (cream) | Nigeria | 0.76 | |
24. | Tube H (cream) | Nigeria | 0.95 |
Table 4: Results of Qualitative Analysis of Cosmetic Products Using n-hexane/acetone and n-hexane/ethyl acetate as Solvents(Pharmacognosy and Herbal Medicine Laboratory, Bayero University, Kano).
S/N | Cosmetic Products Sample Codes | Country Produced | Rf Value | Rf Value for Standard Hydroquinone |
1. | Cream A | Cote d’Ivoire | 0.51 | 0.51 |
2. | Cream B | Cote d’Ivoire | 0.51 | |
3. | Cream C | Cote d’Ivoire | 0.51 | |
4. | Cream D | Cote d’Ivoire | 0.51 | |
5. | Cream E | Togo | 0.61 | |
6. | Cream F | Cote d’Ivoire | 0.83 | |
7. | Cream G | Cote d’Ivoire | 0.67 | |
8. | Cream H | Nigeria | 0.72 | |
9. | Lotion A | Togo | 0.51 | |
10. | Lotion B | Togo | 0.51 | |
11. | Lotion C | Togo | 0.51 | |
12. | Lotion D | Togo | 0.51 | |
13. | Lotion E | Cote d’Ivoire | 0.65 | |
14. | Lotion F | Togo | 0.92 | |
15. | Lotion G | Nigeria | 0.76 | |
16. | Lotion H | Togo | 0.79 | |
17. | Tube A (gel) | Togo | 0.51 | |
18. | Tube B(gel) | Cote d’Ivoire | 0.85 | |
19. | Tube C (gel) | Nigeria | 0.91 | |
20. | Tube D (gel) | Nigeria | 0.83 | |
21. | Tube E (cream) | Togo | 0.77 | |
22. | Tube F (cream) | Nigeria | 0.65 | |
23. | Tube G (cream) | Nigeria | 0.74 | |
24. | Tube H (cream) | Nigeria | 0.98 |
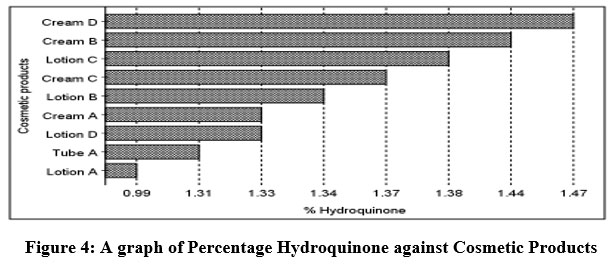 | Figure 4: A graph of Percentage Hydroquinone against Cosmetic Products. Click here to view Figure |
Concentration of Hydroquinone
The results of the quantitative uv/visible spectrophotometric hydroquinone determination in this study for twenty-four skin whitening cosmetics sampled from various retail shops in Lafia Modern Market, which are commonly used in Lafia, Nasarawa State were reported in Figure 4. Some of the packages of the cosmetic products were labelled 2 % of hydroquinone which included creams A, B, C and lotion C, while others were not labelled. In the creams the concentration ranged from 1.33 – 1.47 %. Cream A had the least concentration of 1.33% while cream D recorded the highest value of 1.47 %. Percentageconcentration ofhydroquinone in lotions ranged from 0.99 – 1.38 % with lotion C having the highest value (1.38 %), and lotion A with the lowest value(0.99 %).Only tube A (gel) with 1.31 % had hydroquinone out of the tubes sampled. It was revealed from this study that some of the cosmetics products were not labelled of hydroquinone on their packages, and yet contained hydroquinone. These include cream D, lotions A, B, D and Tube A. Percentage concentration of hydroquinone on the cosmetic products were of the following decreasing order: cream D > cream B > lotion C > cream C > lotion B > cream A = lotion D > tube A > lotion A. Absence of hydroquinoneon fifteen out of twenty-four of the samples suggests that the cosmetic formulations may be safely applied on the skin.
The content of HQ in all the studied samples was less than 2 %, the upper limit permitted by NAFDAC26 and US FDA27. Lee et al.21 had previously reported a concentration of 2.65 % in creams which was higher than the result obtained in this study. Lin et al.25 had also reported hydroquinone concentration of 2.65 % for skin whitening body lotions which was also higher than the one of present study. As earlier mentioned, some cosmetic products sampled in this study claimed no concentration of hydroquinone in their formulation (as it was not displayed on their product label), however, the findings in this study revealed that such products contained appreciable concentration of hydroquinone. In general, cream D had the highest percentage concentration of hydroquinone but the label claimed to be free from hydroquinone. Even though the percentage concentration of hydroquinone of the samples of this study were less than maximum permissible limit of US FDA and NAFDAC of 2 %, their continuous and prolonged usage may cause some bad health issues such as permanent skin damage, disfigurement, irritation, bleaching or skin cancer and so on. It is therefore necessary for regulatory agencies like NAFDAC to regularly monitor cosmetic products to ascertain their level of hydroquinone whether labelled on the products or not. The regulatory agencies should also ensure that warnings of the health effects of frequent and prolonged usage of such products (hydroquinone content-labelled) are indicated on their packages. This is because some of the products meant for moisturizing, soothing and softening of skin that are not hydroquinone-labelled or written free from hydroquinone may contain hydroquinone unknown to the consumers. Again, the cosmetic products containing hydroquinone that are labelled meant for therapeutic purposes are abused by consumers, and used for skin lightening instead of the treatment purpose. And unfortunately, most users do not know the health hazards of frequent and prolonged use of cosmetic products that contain hydroquinone.
Conclusion And recommendations
Conclusion
The sampled skin whitening cosmetics in this study are commonly used by ladies in Lafia. The result obtained from the qualitative and quantitative analysis revealed that some of the skin whitening cosmetics (creams, lotions and tubes) sold in Lafia, Nasarawa State contained hydroquinone (HQ). Even though, it was below US FDA and NAFDAC maximum permissible limit of 2 %, the danger in this case is that some products were labelled free from HQ or not labelled, unknown to users. And frequent and long term usage of such skin whitening cosmetics has been associated with acute and chronic toxicity to health.
Recommendations
- Based on the findings of this study and the harmful effects caused by HQ, it is of high recommendation that there should be a regular monitoring and evaluation of its content on cosmetic products by US FDA and NAFDAC, and the embargo on the use of hydroquinone in skin whitening cosmetics in Nigeria should be enforced. NAFDAC should also enforce the labelling of the health hazards of long term usage of cosmetics containing HQ, and educate the populace on same issue.
- A long term research work should be should be carried out to ascertain the effects of exposure to cosmetic products containing hydroquinone and other benzene metabolites.
Acknowledgement
I acknowledge all members of the research teamwhich include myself (U.A. Augustine), T.M. Akpomie, A.S.Onipede and M.S. Abubakar for our tremendous efforts and enormous contributions to the success and actualization of this research work. The authors acknowledge all technical staff of the Department of Chemistry laboratory, Federal University of Lafia for their assistance during the bench work. Also, the authors are grateful to Federal University of Lafia for allowing us make use of the Laboratory.
Funding Sources
There is no funding or financial support for this research work.
Conflict of Interest
The authors declare no conflict of interest.
References
- Mastore, M., Kohler, L., & Nappi, A. J. (2005). Production and Utilization of Hydrogen Peroxide Associated with Melanogenesis and Tyrosinase?mediated Oxidations of DOPA and Dopamine. The FEBS journal, 272(10), 2407-2415.
CrossRef - Halaban, R., Patton, R. S., Cheng, E., Svedine, S., Trombetta, E. S., Wahl, M. L., Ariyan S. & Hebert, D. N. (2002). Abnormal Acidification of Melanoma Cells Induces Tyrosinase Retention in the Early Secretory Pathway. Journal of Biological Chemistry, 277(17), 14821-14828.
CrossRef - Hamed, S. H., Sriwiiyanont, P., Wickett, R. R., & Boissy, R. (2004). Effect of Deoxyarbutin on Melanogenesis: in Vivo Comparison with other Melanogenesis Inhibitor. Journal of cosmetic science, 55(1), 118-119.
- Verallo-Rowell, V. M., Verallo, V., Graupe, K., Lopez-Villafuerte, L., & Garcia-Lopez, M. (1989). Double-blind Comparison of Azelaic Acid and Hydroquinone in the Treatment of Melasma. Acta Dermato-Venereologica, 69, 58-61
- Attwood D. (2012). Cosmetics. The Science of Dosage Form Design; 83(20); 85-91; 528-529.
- Jiang H. and Yan T. (2011). Determination of Hydroquinone in Cosmetics by GC-MS Weishing Yanjiu, Journal of Pharmaceutical & Biomedical Analysis, 30 (1); 22.
- Holyu (2013). Topical drug bioavailability bioequivalence and penetration”. New York: Plenum Pres. American Journal of Technology: 25(7); 225-259.
- Chang, T. S. (2009). An Updated Review of Tyrosinase Inhibitors. International Journal of Molecular Sciences, 10(6), 2440-2475.
CrossRef - Ranade V. V. and Hollinger M. A. (2014). Transdermal Drug Delivery. In: Kydonieus AF, Berner B, editors. Transdermal Delivery of Drugs: 1(5); 207-248.
- Penney, K. B., Smith, C. J., & Allen, J. C. (1984). Depigmenting Action of Hydroquinone Depends on Disruption of Fundamental Cell Processes. Journal of Investigative Dermatology, 82(4), 308-3
CrossRef - Beaurline J. M., (2019). Gel Formulations for Topical Drug Delivery. United States patent, 8(17); 56-60.
- Brandaio M. A. F. (2018). Anti-ageing Effects of Monomethylsi- Lanetriol and Maltodextrin Stabilized Orthosilicic Acid on Nails, Skin and Hair. Cosmetic Journal, 5(4):12–15.
- Dow D. A. (2019). Topical Gel Delivery Systems for Treating Skin Disorders. European patent, 25(23); 456-500.
- Flynn G. L. (2017). Parameters of skin condition and function. In: Kydonieus AF, Berner B, editors. Transdermal delivery of drugs, 2(9); 3-17.
- Goyal, S., Sharma, P., Ramchandani, U., Shrivastava, S. K., & Dubey, P. K. (2011). Novel Anti-Inflammatory Topical Herbal Gels Containing Withania somnifera and Boswellia serrata. International Journal of Pharmaceutical and Biological Archives, 2(4), 1087-1094.
- Kaur, L. P., Garg, R., & Gupta, G. D. (2010). Development and Evaluation of Topical Gel of Minoxidil from Different Polymer Bases in Application of Alopecia. Int. J. Pharm. Pharm. Sci., 2(SUPPL 3), 43-47.
- Niyaz B. B. (2011). Formulation and Evaluation of Gel Containing Fluconazole-Antifungal Agent. International Journal of Drug Development and Research, 3(4) 109-128.
- Watson, M., Holman, D. M., & Maguire-Eisen, M. (2016). Ultraviolet Radiation Exposure and its Impact on Skin Cancer Risk: in Seminars in Oncology Nursing. American Journal, 32(3):241–254.
CrossRef - Li, Q., Geiselhart, L., Mittler, J. N., Mudzinski, S. P., Lawrence, D. A., & Freed, B. M. (1996). Inhibition of Human T Lymphoblast Proliferation by Hydroquinone. Toxicology and applied pharmacology, 139(2), 317-323.
CrossRef - Gilchrest, B. A., Eller, M. S., Geller, A. C., & Yaar, M. (1999). The Pathogenesis of Melanoma Induced by Ultraviolet Radiation. New England Journal of Medicine, 340(17), 1341-1348.
CrossRef - Lee, J., Jung, K., Kim, Y. S., & Park, D. (2007). Diosgenin Inhibits Melanogenesis through the Activation of Phosphatidylinositol-3-kinase Pathway (PI3K) Signaling. Life Sciences, 81(3), 249-254.
CrossRef - Ketkomol, P., Chongsa, W., & Punjanon, T. (2019). Qualitative and Quantitative Assessment of Hydroquinone in Skin Whitening Cosmetics in Pathum Thani Province, Thailand. Journal of Associated Medical Sciences, 52(3), 170-174.
- Smit, N., Vicanova, J., & Pavel, S. (2009). The Hunt for Natural Skin whitening Agents. International Journal of Molecular Sciences, 10(12), 5326-5349.
CrossRef - Siddique, S., Parveen, Z., Ali, Z., and Muhammad Z. (2012). Qualitative and Quantitative Estimation of Hydroquinone in Skin Whitening Cosmetics. Journal of Cosmetics, Dermatological Sciences and Applications, 2: 224 -228.
CrossRef - Lin, C. H., Sheu, J. Y., Wu, H. L., & Huang, Y. L. (2005). Determination of Hydroquinone in Cosmetic Emulsion using Microdialysis Sampling Coupled with High-performance Liquid Chromatography. Journal of Pharmaceutical and Biomedical Analysis, 38(3), 414-419.
CrossRef - NAFDAC. (2019). National Agency for Food and Drug Administration and Control (NAFDAC) cosmetic products (prohibition of bleaching agents) regulations 2019 by Sections 5 and 30 of the NAFDAC Act Cap N1 LFN 2004 and Section 12 of the Food, Drugs and Related Products (Registration, Etc.) Act Cap F33 LFN 2004. Item 1 No.3. 5pp.
- US FDA. (2010). United States Food and Drug Administration. Hydroquinone Studies Under the National Toxicology Program (NTP). Retrieved from: http://www.fda.gov/ AboutFDA/CentersOffices/OfficeofMedicalProductsandTobacco/CDER/ucm203112.htm.

This work is licensed under a Creative Commons Attribution 4.0 International License.