On ‘Useful’ R-norm Relative Information Measures and Applications
D. S. Hooda1* and D. K. Sharma2
1GJ University of Science and Technology, Haryan, India .
2Jaypee University of Engineering and Technology, A.B. Road, Raghogarh, Distt. Guna, Madhya Pradesh, India .
http://dx.doi.org/10.13005/OJPS07.01.02
Copy the following to cite this article:
Hooda D. S, Sharma D. K. On ‘Useful’ R-norm Relative Information Measures and Applications. Oriental Jornal of Physical Sciences 2022; 7(1).
DOI:http://dx.doi.org/10.13005/OJPS07.01.02
Copy the following to cite this URL:
Hooda D. S, Sharma D. K. On ‘Useful’ R-norm Relative Information Measures and Applications. Oriental Jornal of Physical Sciences 2022; 7(1).Avialable from: https://bit.ly/3DKtM4m
Download article (pdf) Citation Manager Publish History


Introduction
Information theory as a separate subject is about 70 years old. Since information is energy, therefore it is measured, managed, regulated and controlled for the sake of welfare of humanity. The role of information function is to remove uncertainty and the amount of uncertainty removed is a measure of information.
The concept of information proved to be very important and universally useful. These days language used in telephones, business management, and cybernetics falls under the name “Information Processing”. In addition to this, information theory particularly measures of information have applications in physics, statistical inference, data processing and analysis, accountancy, psychology, etc.
Shannon24 was the first who developed a measure of uncertainty. He was interested in communicating information across the channel in which some information is lost in the process of communication and that was called a noisy channel. His objective was to measure the amount of information lost. He defined a measure of uncertainty of a probability distribution as given below:

where k is an arbitrary positive constant. The measure (1.1) was called entropy. Thereafter, Shannon’s entropy was characterized by various researchers like Khinchin1], Fadeev8. Teverberg25, Chandy and Mcleod5, Kendal15, Lee20, Berges2, Cziszar7, Cheng6, etc. on using different sets of postulates.
The quantity (1.1) measures the amount of information of probability distribution P when effectiveness or importance of the events is not taken into account. In addition to this; some probabilistic problems also play important role. Considering effectiveness of the outcomes, Belis and Guiasu1 introduced U= (u1,u2,……,un) as a utility distribution, where ui>0, is the usefulness of an event having probability of occurrence pi and consequently, “self useful information’ is defined as given below:

The measure (1.2) is based two postulated as given below:
P1. In case all the events of an random experiment have the same utility u>0, then the self used information generated by the product of two statistical independent events E1 and E2 can be expressed as the sum of the self-useful information provided by E1 and E2 individually i.e.

where P1*P2 is the probability of E1∩ E2

Further, Belis and Gauisu1 gave the following qualitative and qualitative information measure:

Longo21 called (1.5) as ‘useful’ information and Guiasu and Picard9 called weighted entropy.
In this communication , the ‘useful’ relative information measure is defined and characterized axiomatically in section 2.The new measure thus introduced is generalized in section 3 with its and its particular cases are studied in section 4 . The applications of new R-norm information measure are described in section 5. In section 6 its ad joint by taking empirical data is studied with its illustration graphically. In the end the conclusion is given along with an exhaustive list of references.
‘Useful’ Relative Information Measure
Let X be a random variable in an experiment and
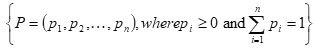
be its probability distribution having U= ( u1, u2…….., un) as a utility distribution, where ui>0 for each i, is the utility of an event having probability pi .
A ‘useful’ directed divergence measure was defined by Bhaker and Hooda3 and characterized as given below:
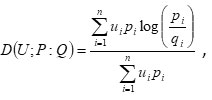
where

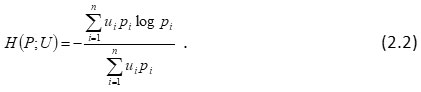
If we consider a uniform probability
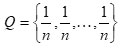
in (2.1), it reduces to log n—H(U;P),
It may be noted that ‘useful’ directed divergence measure D(U;P;Q) satisfies the following conditions:
D(U;P:Q) ≥ 0
D(U;P:Q)= 0
D(U;P:Q)is a convex function of q1,q2,….,qn as well as .P1, P2,…..,Pn
Further, it is observed that (1.1) is not symmetric in P and Q, since D(U;P:Q)≠ D(U;Q:P) .
Later on a symmetric ‘useful’ J- divergence measure was introduced by Hooda and Ram2 as given below:
J(U;P:Q) =D(U;P:Q)+ D(U;Q:P)
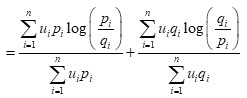
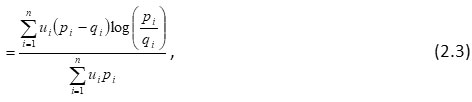
where
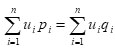
In case ui = 1 for i , then (2.3) reduces to
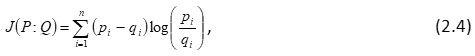
where (2.4) is a divergence measure is due to Jeffrey and thus it is called as J-divergence.
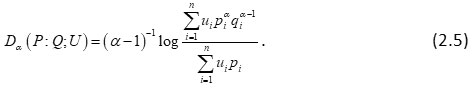
Bhaker and Hooda3 also characterized a ‘useful’ relative information measure of order a as given below:
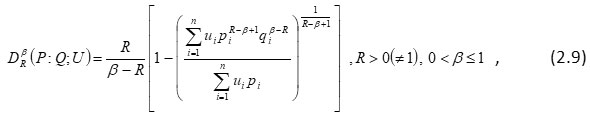
Further Hooda and Ram10 characterized non-additive ‘useful’ relative information of degree β as given below:
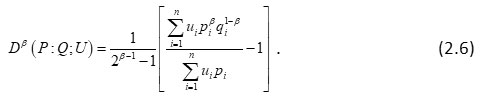
The measure (2.6) reduces to (2.1) when β = 1, while in case ui=1 then (2.6) reduces to Kullback- Leibler’s17 ‘useful’ relative information measure.
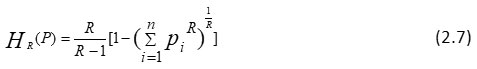
Further Boekee and Lubbe4 defined R-norm information of the distribution P as
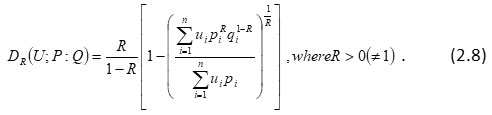
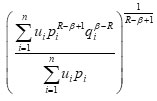
Kumar et al.[18] also defined the following ‘useful’ R-norm relative measure:
There are many other generalizations of (2.8) also and one of them is
where
A ‘Useful’ R-norm Relative Information Measure
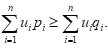
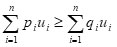
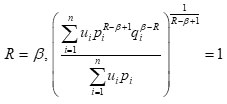
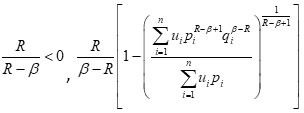
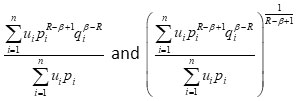
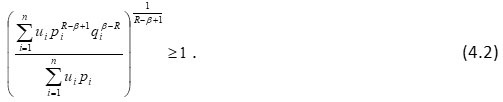
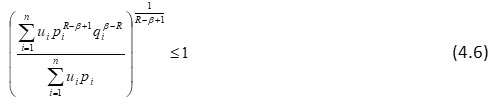
Theorem 3.1 Let P and Q be two probability distributions attached with a utility distribution U, then the following holds:
? 1 according to R ? β under the condition
Proof: We know from Holder’s inequality as
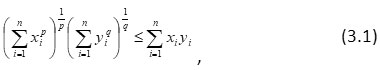
where R >β
, Setting
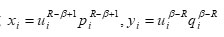
and
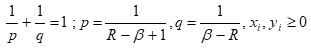
In Holder’s inequality (3.1), we have
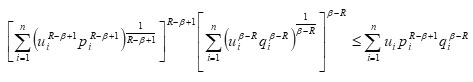
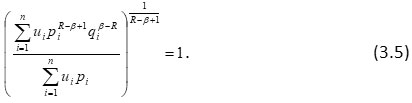
On simplification we have
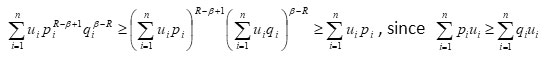
or
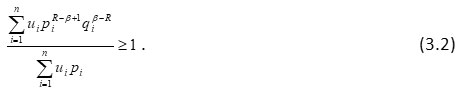
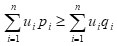
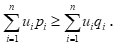
Since

therefore (3.2) can be written as:
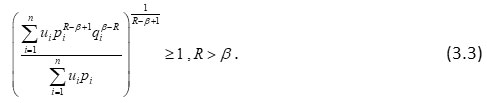
Similarly, we can prove that
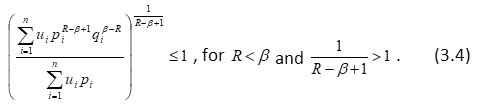
For
for all probability distributions and if R ≠ β and P1 = q1 , for each i , i.e. P= Q, then we have
Theorem 2.2 Dβ(U; P; Q) is a convex function of P and Q.
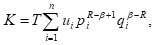
Proof: Let
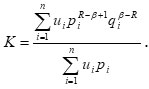
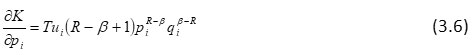
On differentiating K with regard to pi with all q1
and ui having fixed value, we have

fixed and consequently,
is constant
Hence we can write
where

is constant
It implies that
or
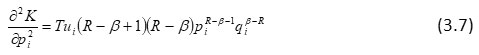
or R – β > 0, (2.6) is positive
It implies that
are convex functions of P in view of

Similarly, for
is also a convex function of P .
For , (3.6) is negative, so
are concave functions of P , since

Hence for R – β <0 & R – β >0 , DRβ( U; P; Q) is also a convex function of P.
On same lines we can prove that Dβ(U;P;Q) is a convex function of Q for R – β >0 and R – β <0 provided
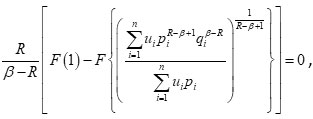
A Generalized ‘Useful’ R-norm Relative information Measure of Degree β
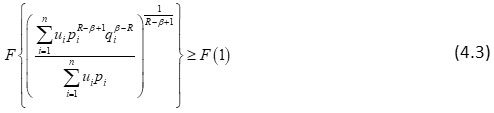
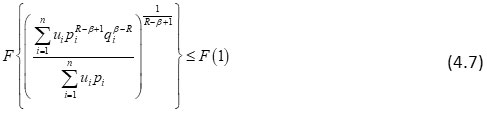
We consider the following function:
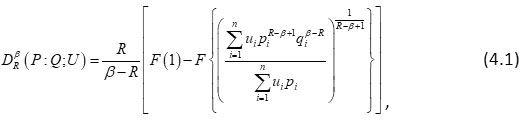
where F(X) is a monotonic increasing function of x.
In view of (3.2), R – β >0 and
, we have
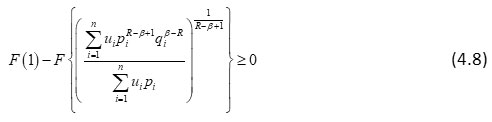
It implies
Or
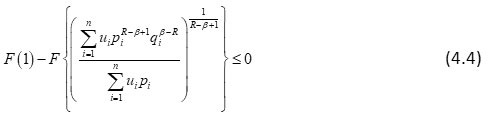
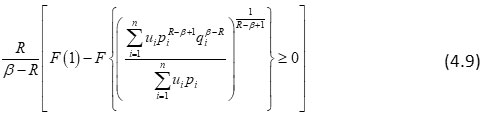
Multiplying (4.3) by  , we get
Similarly, in view of R – β <0, and
, (4.4) can be written as:
It implies that
or
Multiplying (4.8) by

, we get
or

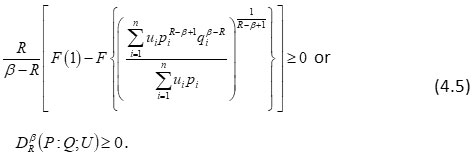
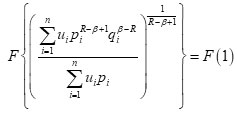
Hence from (4.5) and (4.6) together give

It may be noted that (4.11) vanishes when P1 = q1 for each i .
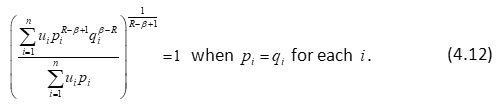
It implies that
when P1 = q1 for each i
or
or
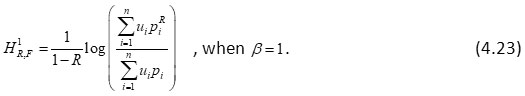
In particular when β = 1 and R → 1, then Dβ( P: Q; U) reduces to
which is (2.1)
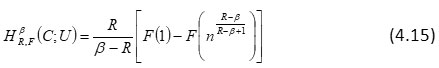
Particular Cases
when
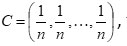
then (4.11) reduces to
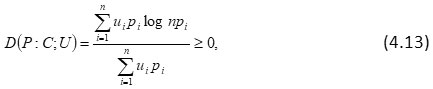
and in case P = C;, D(P;C;U)= 0 .
Further, it can be verified that D(P;C;U) is a convex function of P..
Next, it may be noted that (4.13) can be written as
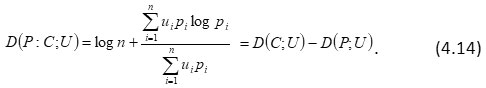
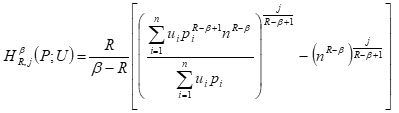
Next we consider
or
and

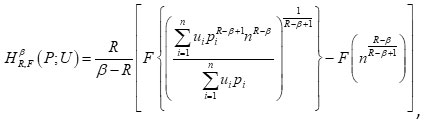
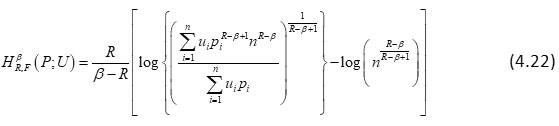
Further, if F(x) = xj, (j ≥ 1),then we have
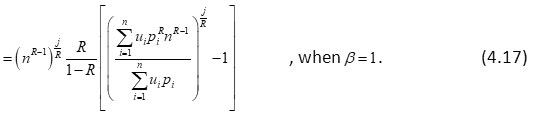
For j= 1, we get
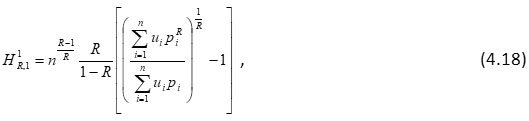
In case R→ 1 the measure (4.13), (4.17) and (4.5) respectively reduce to
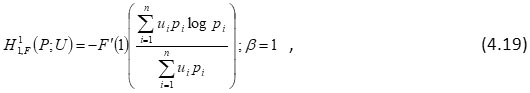
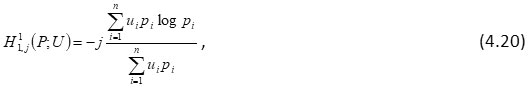
and
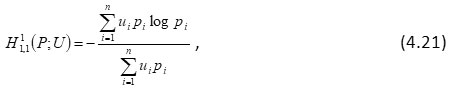
It may be noted that (4.21) was defined and characterized by Bhaker and Hooda3.
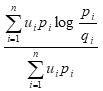
In case F(x)= log x in (4.1), it reduces to
or
In case ui = 1 for each i in (4.10), it reduces

which is well known Renyi’s23 entropy of order R.
Illustration with an Example
In this section we consider production data of different companies due to Nager and Singh22 represented in Table 5.1. We calculate Dβ( P; Q; U) in Table 5.2 and represent graphically in fig.5.1.
Table 5.1: Scanned Copy of Data due to Nager and Singh22
|
S.No |
Company’s Name |
2 Sept 2010 |
pi |
3 Sept 2010 |
qi |
ui |
|
1 |
Reliance Ind. |
10.46 |
0.1046 |
10.44 |
0.1044 |
30 |
|
2 |
Infosys Tech. |
10.04 |
0.1004 |
9.93 |
0.0993 |
29 |
|
3 |
ICICI Bank |
8.38 |
0.0838 |
8.43 |
0.0843 |
28 |
|
4 |
L&T |
8.37 |
0.0837 |
8.39 |
0.0839 |
27 |
|
5 |
ITC |
6.41 |
0.0641 |
6.47 |
0.0647 |
26 |
|
6 |
HDFC |
6.05 |
0.0605 |
6.13 |
0.0613 |
25 |
|
7 |
HDFC Bank |
6.02 |
0.0602 |
6.10 |
0.061 |
24 |
|
8 |
SBI |
5.40 |
0.054 |
5.35 |
0.0535 |
23 |
|
9 |
ONGC |
3.40 |
0.034 |
3.36 |
0.0336 |
22 |
|
10 |
Bharti Airtel |
3.18 |
0.0318 |
3.14 |
0.0314 |
21 |
|
11 |
Tata Consult |
3.01 |
0.0301 |
2.96 |
0.0296 |
20 |
|
12 |
BHEL |
2.89 |
0.0289 |
2.85 |
0.0285 |
19 |
|
13 |
Tata Steel |
2.42 |
0.0242 |
2.44 |
0.0244 |
18 |
|
14 |
Tata Motors |
2.29 |
0.0229 |
2.30 |
0.023 |
17 |
|
15 |
Hindustan Unilever |
2.14 |
0.0214 |
2.15 |
0.0215 |
16 |
|
16 |
Jindal Steel |
2.03 |
0.0203 |
2.02 |
0.0202 |
15 |
|
17 |
M&M |
1.94 |
0.0194 |
1.94 |
0.0194 |
14 |
|
18 |
Hindako |
1.61 |
0.0161 |
1.61 |
0.0161 |
13 |
|
19 |
Sterlite Industry |
1.57 |
0.0157 |
1.59 |
0.0159 |
12 |
|
20 |
Wipro |
1.54 |
0.0154 |
1.54 |
0.0154 |
11 |
|
21 |
Tata Power |
1.48 |
0.0148 |
1.50 |
0.015 |
10 |
|
22 |
NTPC |
1.29 |
0.0129 |
1.28 |
0.0128 |
9 |
|
23 |
Maruti Suzuki |
1.27 |
0.0127 |
1.27 |
0.0127 |
8 |
|
24 |
Hero Honda |
1.19 |
0.0119 |
1.17 |
0.0117 |
7 |
|
25 |
Reliance |
1.18 |
0.0118 |
1.15 |
0.0115 |
6 |
|
26 |
Cipla |
1.12 |
0.0112 |
1.12 |
0.0112 |
5 |
|
27 |
Jaiprakash Assoc. |
0.97 |
0.0097 |
1.01 |
0.0101 |
4 |
|
28 |
DLF |
0.85 |
0.0085 |
0.85 |
0.0085 |
3 |
|
29 |
Reliance Comm. |
0.83 |
0.0083 |
0.83 |
0.0083 |
2 |
|
30 |
ACC |
0.68 |
0.0068 |
0.68 |
0.0068 |
1 |
Next we compute these values of the generalized ‘useful’ r-norm relative measure when R = 2 and β = 0.5 in the following table:
Table 5.2: Values of ‘Useful’ R-norm Relative Measure.
|
|
qi |
ui |
Dβ(P: Q; U) |
|
0.1046 |
0.1044 |
30 |
0.000186868 |
|
0.1004 |
0.0993 |
29 |
-0.00036369 |
|
0.0838 |
0.0843 |
28 |
-0.001666033 |
|
0.0837 |
0.0839 |
27 |
-0.0113086 |
|
0.0641 |
0.0647 |
26 |
-0.000976981 |
|
0.0605 |
0.0613 |
25 |
0.000122931 |
|
0.0602 |
0.061 |
24 |
0.00205616 |
|
0.054 |
0.0535 |
23 |
0.004712 |
|
0.034 |
0.0336 |
22 |
0.00409425 |
|
0.0318 |
0.0314 |
21 |
0.00324745 |
|
0.0301 |
0.0296 |
20 |
0.00212248 |
|
0.0289 |
0.0285 |
19 |
0.0001693 |
|
0.0242 |
0.0244 |
18 |
-0.00188175 |
|
0.0229 |
0.023 |
17 |
-0.00108002 |
|
0.0214 |
0.0215 |
16 |
-0.000645739 |
|
0.0203 |
0.0202 |
15 |
-0.00006348 |
|
0.0194 |
0.0194 |
14 |
-0.000880559 |
|
0.0161 |
0.0161 |
13 |
-0.00107502 |
|
0.0157 |
0.0159 |
12 |
-0.00129549 |
|
0.0154 |
0.0154 |
11 |
0.000681397 |
|
0.0148 |
0.015 |
10 |
0.000855283 |
|
0.0129 |
0.0128 |
9 |
0.0414387 |
|
0.0127 |
0.0127 |
8 |
0.00353355 |
|
0.0119 |
0.0117 |
7 |
0.004735 |
|
0.0118 |
0.0115 |
6 |
0.00125834 |
|
0.0112 |
0.0112 |
5 |
-0.0085101 |
|
0.0097 |
0.0101 |
4 |
-0.0139873 |
|
0.0085 |
0.0085 |
3 |
0 |
|
0.0083 |
0.0083 |
2 |
0 |
|
0.0068 |
0.0068 |
1 |
0 |
Now, the graphically representation of the new ‘useful’ R-norm relative information of degree β when R=2 and β=0.5 is given in fig. 5.1.
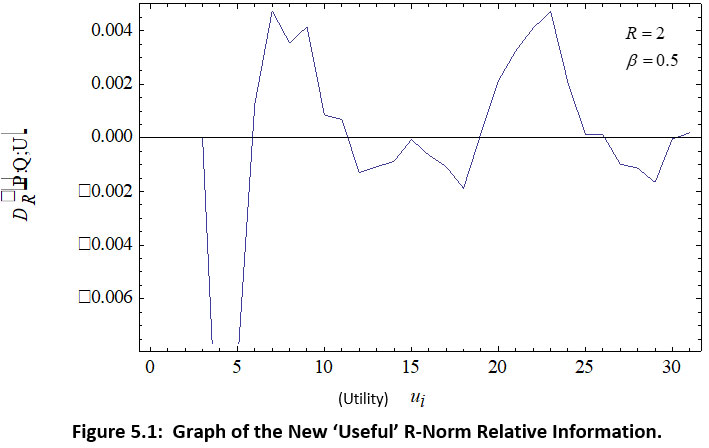 |
Figure 5.1: Graph of the New ‘Useful’ R-Norm Relative Information. Click here to view figure |
The amount of divergence values can be arranged for forecasting the profit maximization in a table as:
Table 5.3: Data of Divergence Values.
|
S.No. |
Name of Company |
Amount of Divergence |
|
1 |
Bharti Airtel |
0.008552 |
|
2 |
HDFC Bank |
0.004735 |
|
3 |
Maruti Suzuki |
0.004712 |
|
4 |
NTPC |
0.004094 |
|
5 |
SBI |
0.003533 |
|
6 |
Tata Power |
0.0032471 |
|
7 |
Wipro |
0.002122 |
|
8 |
Hero Honda |
0.002056 |
|
9 |
ONGC |
0.001443 |
|
10 |
HDFC |
0.00112584 |
|
11 |
Tata Consult |
0.000681397 |
|
12 |
ACC |
0.000186868 |
|
13 |
Sterlite Industry |
0.0001693 |
|
14 |
Reliance |
0.000122931 |
|
15 |
ICICI Bank |
0 |
|
16 |
Infosys Tech. |
0 |
|
17 |
Reliance Ind. |
0 |
|
18 |
Reliance Comm. |
-0.000036369 |
|
19 |
Hindustan Unilever |
-0.0000634824 |
|
20 |
Jindal Steel |
-0.000645739 |
|
21 |
Tata Motors |
-0.000880599 |
|
22 |
Cipla |
-0.000976981 |
|
23 |
Tata Steel |
-0.00107502 |
|
24 |
M&M |
-0.00108002 |
|
25 |
BHEL |
-0.00129549 |
|
26 |
DLF. |
-0.00166033 |
|
27 |
Hindalco |
-0.00188175 |
|
28 |
ITC |
-0.008501 |
|
29 |
Jaiprakash Assoc. |
-0.0113086 |
|
30 |
L&T |
-0.0139873 |
Interpretation
On the basis of values of generalized divergent ‘useful’ R-norm relative information of degree β represented in table 5.3, we can suggest the investor to select the company having maximum divergence value for investment.
Ad Joint of the Generalized Information Measure and its application
On taking Q and P after interchanging in (2.9) , we get
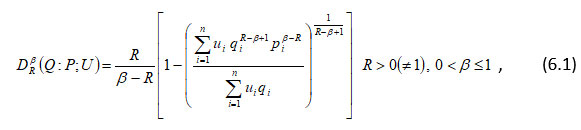
Thus (6.1) is called the ad joint of (2.9). Similarly, we compute these values of the ad joint of generalized measure at R= 2, β = 0.5 and represented table (6.1) as given below:
Table 6.1: Values of ad Joint of Generalized Measure.
|
P1 |
q1 |
ui |
Dβ(Q: P; U) |
|
0.1046 |
0.1044 |
30 |
-0.00000089 |
|
0.1004 |
0.0993 |
29 |
0.000242452 |
|
0.0838 |
0.0843 |
28 |
0.00185256 |
|
0.0837 |
0.0839 |
27 |
0.00134892 |
|
0.0641 |
0.0647 |
26 |
0.00123747 |
|
0.0605 |
0.0613 |
25 |
0.000155902 |
|
0.0602 |
0.061 |
24 |
-0.00179842 |
|
0.054 |
0.0535 |
23 |
-0.00451361 |
|
0.034 |
0.0336 |
22 |
--0.00386599 |
|
0.0318 |
0.0314 |
21 |
-0.00300699 |
|
0.0301 |
0.0296 |
20 |
-0.00187745 |
|
0.0289 |
0.0285 |
19 |
0.0000332657 |
|
0.0242 |
0.0244 |
18 |
0.00204114 |
|
0.0229 |
0.023 |
17 |
0.00125102 |
|
0.0214 |
0.0215 |
16 |
0.000843364 |
|
0.0203 |
0.0202 |
15 |
0.00291878 |
|
0.0194 |
0.0194 |
14 |
0.00114291 |
|
0.0161 |
0.0161 |
13 |
0.00139457 |
|
0.0157 |
0.0159 |
12 |
0.00167957 |
|
0.0154 |
0.0154 |
11 |
-0.00276932 |
|
0.0148 |
0.015 |
10 |
-0.000347704 |
|
0.0129 |
0.0128 |
9 |
-0.0036284 |
|
0.0127 |
0.0127 |
8 |
-0.00288184 |
|
0.0119 |
0.0117 |
7 |
-0.0038725 |
|
0.0118 |
0.0115 |
6 |
-0.000224019 |
|
0.0112 |
0.0112 |
5 |
0.0092187 |
|
0.0097 |
0.0101 |
4 |
0.0149516 |
|
0.0085 |
0.0085 |
3 |
0 |
|
0.0083 |
0.0083 |
2 |
0 |
|
0.0068 |
0.0068 |
1 |
0 |
Considering the above table 6.1, the graph is drawn as given in the following figure 6.1:
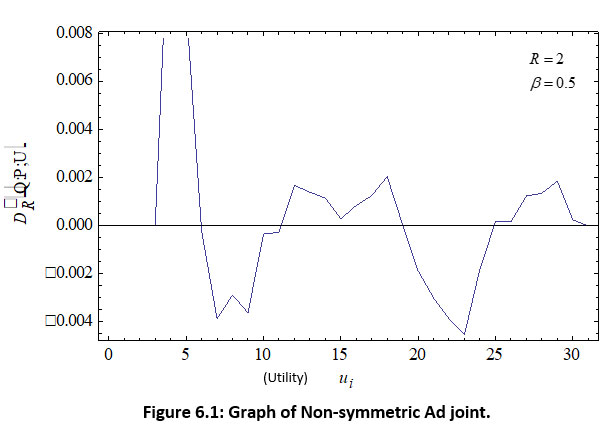 |
Figure 6.1: Graph of Non-symmetric Ad joint. Click here to view figure |
The data for forecasting the profit maximization is arranged as given below:
Table 6.2: Arrangement of Data for Forecasting Profit.
|
Serial No. |
Name of Company |
Divergence Values |
|
1 |
ITC |
0.0092187 |
|
2 |
Hindalco |
0.00204114 |
|
3 |
DLF. |
0.00185256 |
|
4 |
BHEL |
0.00167957 |
|
5 |
Reliance Infras. |
0.00155902 |
|
6 |
L&T |
0.00149516 |
|
7 |
Tata Steel |
0.00139457 |
|
8 |
Jaiprakash Assoc. |
0.00134892 |
|
9 |
M&M |
0.00125102 |
|
10 |
Cipla |
0.00123747 |
|
11 |
Tata Motors |
0.00114291 |
|
12 |
Jindal Steel |
0.000843364 |
|
13 |
Hindustan Unilever |
0.000291878 |
|
14 |
Reliance Comm. |
0.002424432 |
|
15 |
Sterlite Industry |
0.0000332657 |
|
16 |
ICICI Bank |
0 |
|
17 |
InfosysTech. |
0 |
|
18 |
Reliance Ind. |
0 |
|
19 |
ACC |
-0.000000898522 |
|
20 |
HDFC |
-0.000224019 |
|
21 |
Tata Consult |
-0.000276932 |
|
22 |
Bharti Airtel |
-0.000347704 |
|
23 |
HeroHonda |
-0.00179842 |
|
24 |
Wipro |
-0.00187745 |
|
25 |
SBI |
-0.00288184 |
|
26 |
Tata Power |
-0.00300699 |
|
27 |
ONGC |
-0.0036284 |
|
28 |
NTPC |
-0.00386599 |
|
29 |
HDFCBank |
-0.0038725 |
|
30 |
Maruti Suzuki |
-0.00451361 |
Interpretation
The ad joint of’ useful’ R-norm relative information of degree β in decreasing order in the table (6.1 to suggest the investor to make investment in the company of maximum divergence.
Conclusion
In this paper we have defined and characterized the generalized ‘useful’ R-norm relative information of degree β and discussed its particular cases also. The application of this information measure has been studied. The ad joint of this measure is defined and its application in share market and decision making problems are described graphically. The ‘Useful’ R-norm relative information measures of degree and its ad joint are defined and studied in this communication can further be generalized parametrically and applied in planning, forecasting, agriculture, etc.
Conflict of Interest
There is no conflict of interest among the authors of this paper.
References
- Belis, M. and Guiasu S.,”A quantitative –qualitative measure of information in Cybernatic system”, IEEE Trans. Information Theory (1968), IT-4,593-94.
CrossRef - Berges, R.,”Zur Herbitung der Shannon scheme informationmath”.Vol.96,282-87.
CrossRef - Bhaker, U.S. and D.S. Hooda, “Mean value characterization of ‘useful’ information measures”, Tamkang Journal of mathematics (1993), vol. 24, 383-394.
CrossRef - Boekee, D.E. and Lubbe, C.A., “The R-norm Information Measure. Information and Control (1980), Vol. 45, 136-155.
CrossRef - Chandy, T.W. and Mcleod, J.B., ”On a functional equation”, Proc. Edinburgh Math. Soc., Edinburg (1960), Vol. 43, 7-8.
CrossRef - Cheng, M.C., “Information theory and some of its applications”,(1976), Vol.10, 159-171.
- Csiszar,I., “Information measure, a critical survey”,Preprint,Math.Inst. Hung.Acad.Sci.”, (1974 ), 1-24.
- Fadeev D. K., “On the concept of entropies of a finite probabilistic scheme (Russian)”, Uspechi Math. Nauk(1956), Vol.11, 227-31.
- Guiasu, S.and Pichard, C.F., “ Brone inferieure de la longueur de certain codes”,C.R. Acad.Sci.(1971),273, 248-51.
- Hooda, D.S. and Anant Ram, “Mean value characterization of non -additive ‘useful’ relative information measures”, Current trends in mathematics, Statistics and O.R. (2001), pp. 74-89.
- Hooda, D. S, & Kumar, P. Generalized measures of useful directed divergence and Information improvement with applications. Defence Science Journal 54(2), (2004), Pp 125-135.
CrossRef - Hooda,D.S., Upadhaya, K. and Sharma, D. K., “Useful R-norm Information Measure and its Properties”, IOSR Journal of Electronic and Communication Engineering, Vol.8, 52-57.
CrossRef - Hooda,D.S., Upadhaya, K. and Sharma, D. K., “On Parametric Generalization of ‘Useful’ R-norm Information Measure”, British Journal of Mathematics & Computer Science Vol 8(10),(2015), Pp. 1-15.
CrossRef - Jeffery’s, H., “An invariant form for the prior probability in estimation problems”, Proceeding of the royal society of London, vol. 186, pp.453-461.
CrossRef - Kendall, D.G., “Functional equation in information theory”, Z. Wahrs Verw. Geb.”, (1964), Vol. 2, 225-29.
CrossRef - Khinchin,A.I., “ The concept of entropy in the theory in the theory of probability”, Uspechi Math. Nauk(1953), 8(3), 35.
- Kulback, S. and Leibler, R.A. “Information Theory and Statistics”, New York, John Wiley.
- Kumar, Satish, Gurdas Ram and Vishal Gupta, “On ‘useful’ R-norm relative information and J- divergence measures”, International journal of pure and applied mathematics(2012),vol.77No.3, 349- 358.
- Leibler, R.A. and S. Kullback, “On information and sufficiency”, The Annals of Mathematical Statistics (1951), vol.22, pp.79-86.
CrossRef - Lee, P.M., “On axioms of information theory”, Ann. Math. Stat. (1964),35, 414-18.
CrossRef - Longo, G., “A quantitative-qualitative measure of information”, Springer Verlag, 1972.
CrossRef - Nager, Ruchi and R.P. Singh, “Application information Theoretic divergence measures-Forecasting profit maximization in share market”, GSTF journal of mathematics, Statistics and Operation research (2013), Vol.2, pp.45-53.
CrossRef - Renyi, A. “On measure of entropy and information, In: Proc 4-th Barkley symposium”, on Mathematics, Statistics and Probability, University of California Press (1966), 547-561.
- Shannon, C.E., “ A mathematical theory of communication”, Bell System Tech. Journ.(1984), Vol. 27, 379-423.
CrossRef - Tverberg, H., “A new derivative of the information function”, Math. Scand (1958), Vol.6, 297-98.
CrossRef

This work is licensed under a Creative Commons Attribution 4.0 International License.