Spatial Data Analysis For Ground Water Quality Assessment With Special Refrence To Iron - A Case Study Of Barna Watershed,Raisen District, Madhya Pradesh, India
D.K. Umak 1* , V. L. Punwatkar 2 and V.K. Parasher 3
1Bhopal, M. P. Council of Science and Technology, Bhopal, M.P India .
2Govt, MVM, Bhopal, M.P India .
3Indore, Govt. Holkar Science College, Indore, M. P India .
http://dx.doi.org/10.13005/OJPS02.01.07
Barna Watershed is a catchment of Barna River and its tributaries, lies in the Raisen district of Madhya Pradesh. The total area of Barna Watershed is approximately 1129 Sq. Km. The aim of the study was to analyze the observed ground water quality parameters and to create spatial map for drinking water purpose for Barna Watershed. For the above study ground water Samples were collected from the field and some GWQ data were collected from PHED, M.P and National Rural Development Water Programme (IMIS) website under Ministry of Drinking water & Sanitation. The GWQ layers were generated separately for each element for Both Pre-Monsoon and Post-Monsoon Season, from the well point layers with the help of Inverse Distance weighted Method (IDW) interpolation technique using ArcGIS 9.3 software. Each element wise layer has been categorized into three categories (1) potable water in Desirable limits (2) Potable water in permissible limits (3) Non-potable ground water, as per BIS standard 2012. Integrating layers of pre-monsoon; pre-monsoon Ground Water Quality map has been prepared and integrating layers of post-monsoon; post-monsoon Ground Water Quality map has been prepared. Integrating the pre & post monsoon Ground water quality map, final ground water quality class map has been prepared. The Final Ground Water Quality class map has been divided into 9 classes as the standard given by the NRSC, ISRO; Ground Water Quality, manual of RGNDWM-PH IV. The Final Ground Water Quality Class map of Barna Watershed shows, out of 75.04% Non-Potable area73.12% area is Non- Potable due to excess of Iron and out 65.51% Habitations which is falling in Non-Potable class, 56.89% habitation are severely affected by excess of Iron.
Copy the following to cite this article:
Umak D. K, Punwatkar V. L, Parasher V. K. Spatial Data Analysis For Ground Water Quality Assessment With Special Refrence to Iron - A Case Study Of Barna Watershed,Raisen District, Madhya Pradesh, India. Orient J Phys Sciences2016;1(1).
DOI:http://dx.doi.org/10.13005/OJPS02.01.07Copy the following to cite this URL:
Umak D. K, Punwatkar V. L, Parasher V. K. Spatial Data Analysis For Ground Water Quality Assessment With Special Refrence to Iron - A Case Study Of Barna Watershed,Raisen District, Madhya Pradesh, India. Orient J Phys Sciences2016;1(1). Available from: https://bit.ly/395SZqO
Download article (pdf) Citation Manager
Introduction
The Ground water has long been regarded as the pure form of water compared to surface water, because of purification of the former in the soil column through anaerobic decomposition, filtration and ion exchange. This is one of the reasons for the excessive consumption of groundwater in rural and semi-urban areas all over the world (Saha et al., 2008). Groundwater can become contaminated naturally or because of numerous types of human activities; residential, municipal, commercial, industrial, and agricultural activities can all affect groundwater quality (Jalali 2005). In developing countries like India around 80% of all diseases are directly related to poor drinking water quality and unhygienic conditions (Olajire and Imeokparia, 2001).
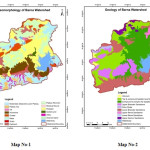 |
Figure 1 |
An adequate quantity of safe drinking water of acceptable quality is the primary necessity of every human being. India has large Human settlements in rural areas and villages which face problems of water quality and quantity, available water resources and seasonal scarcity of water. The villages mainly depend upon surface water resources, dug well water or bore well water. Surface water usually pose problem of turbidity while the bore well may pose the problems of Hardness, Fluorides and dissolved Iron. It is therefore important from the water supply point of view that critical evaluation of water treatment system need to be done on the primary factors which include raw and treated water quality, local constraints and relative cost. Simple, versatile, cost effective and innovative water treatment systems are the primary need in India for their implementation in rural areas and villages for supply of adequate quantities of safe potable water. Remote Sensing & GIS Techniques can support up to a great extent for Ground Water Quality mapping.
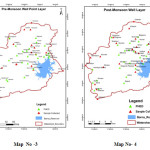 |
figure 2
|
Raisen district is situated in the central part of Madhya Pradesh and covers an area of 8466 sq. km. it falls in survey of India degree sheets no’s 55E, F, I & J, between the latitude 22047’19” and 23044’48” North and the longitude 77020’13”and 78049’04” East. It is bounded, in the North by Vidisha district, in the Northeast by Sagar district, in the Southeast by Narsinghpur district and in the South by Hoshangabad and Sehore district & in the West by Bhopal district. The Narmada river flows along the south-eastern boundary of the district and separate it from the Narsinghpur and Hoshangabad district. It is affected by very Hot summer up to 46oC temperature while Minimum temperature during winter falls up to 5-6ËšC.
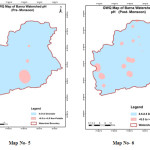 |
Figure 3
|
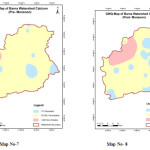 |
Figure 4 |
The study area Barna, watershed is is lying in the central and southern part of the Raisen district and falling in survey of India Toposheets no’s 55E/12, 55E/15, 55E/16, 55I/3, 55I/4, 55F/9, 55F/13, and 55J/1.The area lies between the latitude 220 54’ 00” to 230 18’ 00 North and the longitude 770 43’ 00” to 780 06’ 00”East and, covering an area of about 1129 sq. km. The Barna River is a tributary of Narmada River and Barna dam is built across Barna River, which is located 2.5 km .N-W of barikhurd village of Tehsil Bari district, Raisen. The total number of settlements lying in Barna watershed is 116
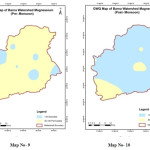 |
Figure 5
|
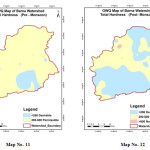 |
Figure 6
|
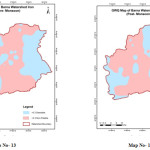 |
Figure 7
|
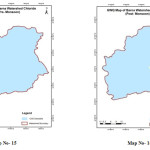 |
Figure 8
|
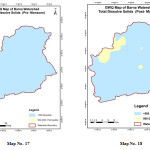 |
Figure 9
|
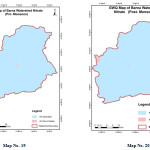 |
Figure 10
|
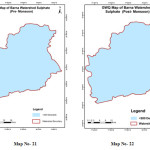 |
Figure 11 |
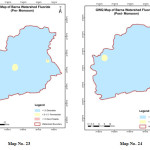 |
Figure 12
|
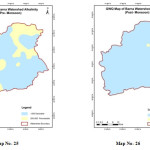 |
Figure 13
|
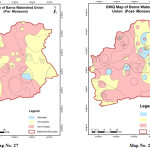 |
Figure 14
|
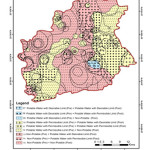 |
Figure 15
|
Data and Methodology
Survey of India Toposheets No’s 55E/12, 55E/15, 55E/16, 55I/3, 55I/4, 55F/9, 55F/13, and 55J/1 were used for creating a Base map. Indian Remote Sensing LISS III-P6 digital Satellite data of the year 2009-2010 for three seasons (January, April and October) were used for the interpretation.
Thematic maps like settlement, water bodies are prepared by using survey of India Toposheets. Geology, Geomorphology and lineaments are prepared by using the satellite data of IRS P6 LISS-III data of January, April and October and DRM (District Resource Map) published by GSI.
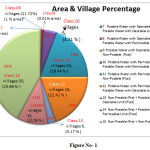 |
Figure 16 |
The Ground Water Samples were collected from the field and some GWQ data were collected from PHED, M.P and National Rural Development Water Programme (IMIS) website of the year 2009, 2010, 2011, and 2012, under Ministry of Drinking water and Sanitation & organize the ground water quality data of pre monsoon and post monsoon season. In pre monsoon season, out of 50 GWQ data plotted,19 ground water samples were collected from the field & pre mansoon wellpoint layer (Map No3) is prepared , in post monsoon out of 44 GWQ data plotted, 19 ground water samples were collected from the field & post mansoon wellpoint layer (Map No 4) is prepared. These all 38 Samples of pre & post monsoon were analysed in State Research Lab of PHED,M P, Bhopal which is NABL accredited Lab , i.e. ISO : IEC : 17025: 2005 & all 11 essential parametrs were analysed. The essential 11 parameters are pH, Total hardness, Iron, chloride, TDS, Nitrate, Sulphate, Fluoride, Alkalinity, Calcium and Magnessium. With the Well Point layer of pre moonsoon and post monsoon with their elements, pH, pre monsson (Map No 5) & pH, postmonsson (Map No 6) , Ca, pre monsoon (Map No 7) & Ca, post monsoon (Map No 8), Mg, pre monsoon (Map No 9) & Mg, post monsoon (Map No 10), Total Hardness, pre monsoon (Map No 11 ) & Total Hardness , post monsoon (Map No 12 ), Iron, pre monsoonas (Map No13) & Iron, post monsoon (Map No14) , Chloride,pre monsoon (Map No15) & Chloride ,post monsoon (Map No16) , Total dissolve solids, pre monsoon (Map No17) & Total dissolve solids , post monsoon (Map No18), Nitrate , pre monsoon (Map No19) & Nitrate, post monsoon (Map No20) , Sulphate, pre monsoon (Map No21) & Sulphate, post monsoon (Map No22) , Fluoride, pre monsoon (Map No 23) & Fluoride , post monsoon (Map No 24), & Alkalinity , pre monsoon (Map No 25) & Alkalinity, post monsoon (Map No 26) maps were generated. All these Element wise layers for pre monsoon and post monsoon layers (Map No 6 to Map No 26) was created by using statistical methods IDW (Inverse distance weighted) and classify into the desirable, permissible, and non-Potable class as per BIS standards 2012 in ArcGIS software. By union of all Pre-monsoon above generated layers , an integrated pre-monsoon ground water quality map (Map No27) have been generated and by union of all Post-monsoon layers, an integrated post-monsoon ground water quality map (Map No28) has been generated. By union of Pre-monsoon ground water quality map (Map No27) and post-monsoon ground water quality map (Map No28) , Final ground water quality class map (Map No29) has been generated of the study area.
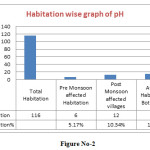 |
Figure 17 |
Physiography and Geomorphology
The Study area Barna Watershed is broadly be divided into three physical divisions, wiz;-
The Vindayanchal range and its associated hills.
The Malwa plateau.
The plains of the Narmada valley.
The geomorphological Map (Map No 1) of the Barna watershed is prepared by adopting the schema of National Geomorphological & Lineament project (NGLM) project, that is, pure genetic based classification system has been adopted after consensus arrived between GSI and ISRO. The study area has landform of structural origin, landforms of Denudational origin & Landforms of Fluvial Origin. The landforms of structural origin are Moderately Dissected Lower Plateau, Plateau Remnant, Plateau Top, Homocline, Cuesta, Mesa, Hill, and Valley & Scarp. The landforms of Denudational origin are Pediment, Pediplains Gullied land & Residual Mound. The landforms of Fluvial Origin are Channel Island.
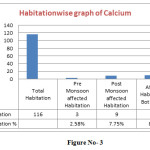 |
Figure 18 |
Geology of the Study Area
The study area Barna watershed is lying in the central and southern part of the Raisen district. The rock exposed in the area includes Vindhyan sediments, Basaltic lava flows of Deccan trap and Alluvium. The geological map (Map No 2) of the study area has been prepared by using satellite, IRS-P-6,LISS III data path 98 row 55 & using ARC GIS software version 9.3.The District Resource Map of Raisen district Published by Geological Survey of India is also referred & also verified by limited field check before finalizing the geological map.
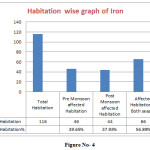 |
Figure 19 |
Results and Discussion
In the present study attempt has been made to generate the ground water quality class map by integration of Pre-monsoon ground water quality class map and Post-monsoon ground water quality class map. In the final ground water quality class map the following 9 classes have been identified. (Figure No- 1)
Non-Potable water (Pre-Monsoon)+Non-Potable water(Post-Monsoon................... 15
This class covers an area of 473.99 /sq km which is 42 % of the total study area and total 30 habitations which is 25.86 % are lying in this class. This Class is mainly lies in the Northern, Central, southern, & Western part of the study area lying mainly in the Vindhyan & Basaltic region. This class is Non-Potable in both Pre & Post monsoon season due to the concentration of the following elements - (1) pH- 5 to 8.6 mg/l (2) Iron- 0.1 to 3 mg/l (3) Nitrate- 0.7 to 53.7 mg/l (4) Ca- 25 to 392.6mg/l
Non-Potable water(Pre-Monsoon) + Potable water with Permissible limits(Post-Monsoon)................... 14
This class covers an area of 120.16 sq.km which is 11 % of the total study area and 14 habitation which is 12.06 % are lying in this class. This area is mainly lies in the Northern & south eastern part of the study area lying in the Basaltic region and this class is Non-Potable water in Pre-Monsoon due to the concentration of the elements. (1) pH- 5.5 to 8.5 mg/l (2) Iron- 0.2 to 2.6 mg/ (3) Nitrate- 14 to 50.2 mg/l (4) Fluoride- 0.1 to 1.7
Non-Potable water (Pre-Monsoon) + Potable water with desirable limits (Post-Monsoon)................... 13
This class covers an area of 30.51 sq.km which is 3 % of the total study area and 6 habitation which is 5.17% are lying in this class. This area lies in the Central part of the study area lying in the Basaltic region and this class is Non-Potable in Pre-monsoon and Potable water with desirable limits in Post-monsoon season due to the concentration of the elements. (1) Iron- 0.6 mg/l (2) Fluoride 1.6 mg/l
Potable water with Permissible limits (Pre-Monsoon)+Non-Potable water(Post-Monsoon)................... 12
This class covers an area of 222.51 sq.km which is 20 % of the total study area and 26 habitation which is 22.41% are lying in this class. This area is mainly lies in the Northeastern, central & Southern part of the study area lying in the Basaltic region and this class is Non-Potable water in Post-monsoon season due to the concentration of the following elements (1) pH- 5.5 to 8.5 mg/l (2) Iron- 0.1 to 2.8 mg/l (3) Nitrate- 0.6 to 51.3mg/l Ca- 31.6 to 1007 mg/l, Total Hardness- 75 to 1041 mg/l.
Potable water with Permissible limits (Pre-Monsoon) + Potable water with Permissible limits (Post-Monsoon)................... 11
This class covers an area of 217.59 sq.km which IS 19 % of the total study area and 33 habitation which is 28.44 % lying in this class. This area is mainly lies in the eastern & South-western part of the study area.
Potable water with Permissible limits (Pre-Monsoon) + Potable water with desirable limits (Post-Monsoon)................... 10
This class covers an area of 52.39 sq.km, which is 4 % of the total study area. 5 habitations which are 4.31 % are lying in this class.
Potable water with desirable limits (Pre-Monsoon) + Non-Potable water (Post-Monsoon)................... 9
This class covers an area of 0.11 sq.km which is 0.009 % of the total study area.
Potable water with desirable limits (Pre-Monsoon) + Potable water with Permissible limits (Post-Monsoon)................... 8
This class covers an area of 8.88 sq.km which is 1 % of the total study area and covers 2 habitation which is 1.72 % are lying in this class
Potable water with desirable limits (Pre-Monsoon)+Potable water with desirable limits(Post-Monsoon)................... 7
This class covers an area of 3.02 sq.km which is 0.26 % of the total study area.
Conclusion
The iron is the main element which is being found beyond permissible limit in the study area. In pre-monsoon season 46 Habitation out of 116 Habitations which is 39.65%, are affected by excess of iron while in post-monsoon season 44 Habitations which is 37.93% are affected by excess of iron and in Both the pre and post monsoon seasons 66 Habitations which is 56.89% ,of the total Habitations are affected by excess of iron which is non-potable (Figure No- 4) , While only 12.93% of the total Habitations are affected by excess of pH (figure No- 2) and only 8.62% Habitations are affected by excess of Calcium (Figure No- 3) in Both the pre and post monsoon seasons.
In potable water iron is objectionable because, it gives bitter test and excessive concentration of iron cause gastrointestinal upset and moreover it stains the cloth, teeth, gums and utensils. Normal amount of iron is essential, but abnormally larger amount adversely affect the human system and result in a condition known as Hemochromatosis wherein tissues are damaged due to prolonged iron accumulation. (Raju 2006). The excess of Iron more than 0.3 mg/l caused Hemochromatosis, Diabetes, Cancer, Heart diseases, Enlargement of the lever, Impotency, Weight loss, Weakness, Enzyme dysfunction, Inflammation (Jain Rahul 2013).
References
- District Resource Map Raisen District, 2000, Published by Geological Survey of India.
- Ground Water Quality Mapping, Rajiv Gandhi National Drinking Water Mission (RGNDWM), (2011). Methodology Manual, Hydrogeology Group, NRSA, National Remote Sensing Centre, Indian Space Research Organisation, Dept. of Space, Govt. of India, Hyderabad.
- Jalali, M., 2005. Nitrates leaching from agricultural land in Hamadan, Western Iran. Agriculture, Ecosystems and Environment, 110: 210-218.
- Jain Rahul, (2013) Ground Water Quality Mapping around Keolari in Seoni District of M.P. using Remote Sensing and GIS Techniques, Project Report for M. Tech. degree at NIT Warangal.
- National Geomorphological and Lineament Mapping on 1:50,000 scale, 2010, Manual, Geological Survey of India Ministry of Mines Government of India and Indian Space Research Organisation Department of Space Government of India.
- Olajire, A., A., Imeokparia F., E., (2001). Water quality assessment of Osun River: Studies on inorganic nutrients. Environ. Monitor. Assess. 69(1): 17-28.
- Raju N. Janardhana (2006), Iron contamination in ground water- A case from Tirumala -Tirupati envieons, India. The Researcher Vol 01, No. 01 July Sept 2006.
- Sarala, C, Ravi Babu P. (2012) Assessment of Groundwater Quality Parameters in and around Jawaharnagar, Hyderabad. International Journal of Scientific and Research Publications, Volume 2, Issue 10, October 2012 1 ISSN 2250-3153.
- Saha, D., Dhar, Y.R. and Sikdar, P.K. Geochemical Evolution of Groundwater in the Pleistocene Aquifers of South Ganga Plain, Bihar. Jour. Geol. Soc. India, Vol.71, 2008: pp. 473-482.

This work is licensed under a Creative Commons Attribution 4.0 International License.