The Potential of Heavy Metals Contamination in the Surface Sediments of River Nile, Egypt
Mohamed Nageeb Rashed1*  , Mohamed ELSadeek Fouad Toufeek2 , Mahmoud Abedeldaium Eltaher1 and Ayman Outhman Elbadry2
1Chemistry Department, Faculty of Science, Aswan University, Aswan, Egypt .
2National Institute of Oceanography and Fisheries (NIOF), Aswan, Egypt .
http://dx.doi.org/10.13005/OJPS03.02.09
Electrical conductivity, pH, organic matter, carbonates and five heavy metals (Fe, Mn, Zn, Cu and Pb) were measured seasonally in the sediments of River Nile (Egypt) during 2015. Ten sectors include 30 sites were selected along River Nile from Aswan to Armant to assess the levels of the studied parameters. Heavy metals in sediments were in the order of Pb < Cu < Zn < Mn < Fe, which indicated that Pb was found to be the least concentration in sediments, whereas Fe was the most accumulated element. Pearson’s correlation coefficients among the measured parameters were tested. Zn, Cu and Pb were positively correlated with electrical conductivity and organic matter accumulation and also they were positively correlated with each other. Sediments pollution load was studied through pollution indices [geo-accumulation index, pollution load index, modified degree of contamination, contamination factor and enrichment factor]. The pollution indices confirmed that the River Nile sediments in the studied area were not contaminated with these heavy metals except for some samples collected from certain sites as a result of the anthropogenic activities at these sites.
Copy the following to cite this article:
Rashed M. N, Toufeek M. E. F, Eltaher M. A, Elbadry A. O. The Potential of Heavy Metals Contamination in the Surface Sediments of River Nile, Egypt. Orient J Phys Sciences 2018;3(2).
Copy the following to cite this URL:
Rashed M. N, Toufeek M. E. F, Eltaher M. A, Elbadry A. O. The Potential of Heavy Metals Contamination in the Surface Sediments of River Nile, Egypt. Orient J Phys Sciences 2018;3(2). Available from: https://bit.ly/36MQWbc
Download article (pdf) Citation Manager Publish History
Introduction
River Nile is one of the largest rivers in Africa , with an area of 2.9 x 10⁶ km2 extending from latitude 4° south to latitude 31°N. This river flows northward into the Mediterranean Sea from its remotest source in Tanzania into the outlet of Damietta and Rosetta branches, Egypt.1
River Nile provides water for drinking, irrigation, industrial use and fishing.2 Domestic, agricultural and industrial wastewater is causing pollution to the aquatic ecosystem of River Nile, where uncontrolled wastewater discharges resulted in water quality health impacts on human and fish.3
Heavy metals are toxic to a water body. Soil leaching and weathering of minerals are the natural sources of heavy metals in water. The anthropogenic sources of water pollution with heavy metals are associated with domestic, agricultural and industrial wastewater. Heavy metals contamination in aquatic ecosystems affected on plant and animal.4 Heavy metals such as Fe, Mn, Cu and Zn are essential metals with a vital role in biological systems, whereas Pb and Cd are toxic metals5. Heavy metals bioaccumulate, in living tissues, causing some serious health concerns.6
There is increasing interest in understanding the extent to which contaminant metals associated with river sediments are bioavailable to organisms. Heavy metals accumulate in aquatic ecosystems (water, biota and sediments). Sediments have a main role in the remobilization of heavy metal pollution in aquatic systems.7 Sediments are responsible for transporting of heavy metals in the aquatic environment,8 and have the potential to release the bound metals to overlying water.9 High levels of heavy metals in sediment resulted from anthropogenic influences.10 The sediment quality of River Nile and heavy metals contamination have been the topics of interest for many authors.11-19
Rivers and other water-stream settings are prone to receive significant metal inputs along their course from different sources. Once heavy metals enter water stream, they can be quickly adsorbed onto particles and eventually deposited in sediments where accumulate. However, river systems are highly complex where finer sediments with larger surface area may enhance trace metal enrichment (low hydrodynamic energy), while in high energy flows, fine metal-rich particles are removed from the river bed and transported to the water column. It is therefore important to assess the extent of metal enrichment in river sediments since they can act as point sources of contamination to other unpolluted sites.
This study aimes to assess the spatial and temporal (seasonal) variation of physico-chemical characteristics (electrical conductivity, pH, organic matter and carbonates) and some heavy metals (Fe, Mn, Zn, Cu and Pb) along a 200 km stretch of River Nile, Egypt. Also, to study the relationships among heavy metals concentration and key environmental parameters (i.e. electrical conductivity, pH, organic matter and carbonates). Additionally, the contamination levels of River Nile sediments with heavy metals (Fe, Mn, Zn, Cu and Pb) will be examined by using different pollution indices such as contamination factor (Cf), enrichment factor (EF), pollution load index (PLI), modified degree of contamination (mCd), and geo-accumulation index (Igeo).
Materials and Methods
Study Area
Samples of surface sediments were collected during 2015 from the midstream (M), eastern (E) and western (W) banks of ten different sectors along River Nile from Aswan to Armant, Egypt as shown in Fig. 1. Description of sampling locations along River Nile is illustrated in Table 1.
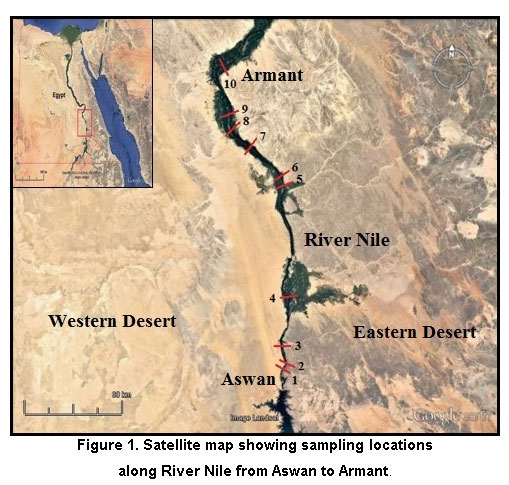 |
Figure 1:Satellite map showing sampling locations along River Nile from Aswan to Armant |
Table 1: Description of sampling locations along River Nile.
|
Sector symbol |
Sector features |
Latitude |
Longitude |
Distance downstream from Aswan sector |
|
1 |
Aswan, in front of touristic ships mooring |
24°05'58.39"N |
32°53'39.30"E |
Initial sector |
|
2 |
Gezira, in front of El-Sail drain |
24°06'58.82"N |
32°53'43.84"E |
1.87 km |
|
3 |
Khattara, before Aswan Bridge |
24°11'30.23"N |
32°51'58.99"E |
10.8 km |
|
4 |
Kom Ombo, in front of Kom Ombo drain |
24°27'20.15"N |
32°55'20.00"E |
41.3 km |
|
5 |
Atwany, in front of Egyptian Ferroalloys Factory drain |
25°00'40.29"N |
32°52'44.17"E |
110.52 km |
|
6 |
Domariya, in front of Edfu Sugar Cane Factory drain |
25° 2'53.50"N |
32°51'46.91"E |
114.92 km |
|
7 |
Sebaiya, in front of Phosphate Port |
25°12'31.36"N |
32°40'24.37"E |
141.73 km |
|
8 |
Esna, in front of touristic ships mooring |
25°17'49.88"N |
32°33'35.06"E |
157.47 km |
|
9 |
Farisiya, after New Esna Dam |
25°21'01.30"N |
32°33'19.30"E |
163.37 km |
|
10 |
Armant, in front of Armant Sugar Cane Factory drain |
25°36'08.92"N |
32°30'52.57"E |
197.57 km |
There are contamination sources for River Nile in the studied area which are:
- Leaded petrol used in outboard boat engines.
- El-Sail drain, which receives domestic wastewater and industrial wastewater from Egyptian Chemical Industries Company (KIMA) producing ammonium nitrate fertilizer and are directly disposed into the eastern side of River Nile.
- Kom Ombo drain, which receives agricultural wastewater and industrial wastewater from Kom Ombo Sugar Cane Factory and are directly disposed into the eastern side of River Nile.
- Egyptian Ferroalloys Factory drain, which receives industrial wastewater and is directly disposed into the eastern side of River Nile.
- Edfu Sugar Cane Factory drain, which receives industrial wastewater and is directly disposed into the western side of River Nile.
- Phosphate rocks transported by ships from Sebaiya Phosphate Port located in the western side of River Nile.
Armant Sugar Cane Factory drain, which receives industrial wastewater and is directly disposed into the western side of River Nile.
Sampling and storage
Thirty surface sediment samples (top 0-5 cm; 2 kg approximately for sample) were collected seasonally during winter (February), spring (May), summer (August) and autumn (November) 2015 by standard Ekman grab sampler (Wildco 196-B12, USA), packed in airtight polyethylene bags to minimize oxidation and stored at approximately 4°C until returning to the laboratory. Upon reaching the laboratory, samples were air-dried at room temperature. Later subsamples of the sediments were sieved through a 500 µm sieve (W.S. TYLER ASTM E-11 No. 35, USA) to be of regular particle sizes and to remove non-sediment particles and oven-dried (FALC STF-N 240, Italy) at 105 °C for 24 h to get rid of the moisture content. Then the samples were stored until analysis.20,21
Reagents and Standards
The reagents used were of analytical reagent grade: potassium dichromate (Rankem, India), concentrated sulfuric acid AR 98% (SDFCL, India), 1,10-phenanthroline monohydrate (BDH, England), ferrous sulfate heptahydrate (Nice, India), ferrous ammonium sulfate hexahydrate (Alpha Chemika, India), concentrated hydrochloric acid AR 35.4% (SDFCL, India), sodium carbonate (Adwic, Egypt), methyl orange (SDFCL, India), and concentrated nitric acid AR 69 % (SDFCL, India).
1. Standard potassium dichromate (0.25N): Dissolve 12.2577 g K2Cr2O7, previously dried at 150ºC for 2 hrs, in distilled water and dilute to 1000 mL.
2. Standard ferrous ammonium sulfate (0.25N): Dissolve 98.035 g FAS in distilled water. Add 20 mL conc. H2SO4, cool and dilute to 1000 mL with distilled water. Prepare freshly.
3. Ferroin indicator: Dissolve 1.485 g 1,10-phenanthroline monohydrate and 0.695 g FeSO4.7H2O in distilled water and dilute to 100 mL. Dilute this reagent by a factor of five (1:4).
4. Standard hydrochloric acid (0.2N): Cautiously add 8.73 mL 35.4 % conc HCl to approximately 400 mL distilled water with mixing and dilute to 500 mL.
5. Standard sodium carbonate (0.2N): Dissolve 10.599 g Na2CO3 in distilled water and dilute to 1000 mL.
Analytical methods
The pH and electrical conductivity (EC) of sediment samples were measured by using a portable meter (Martini Mi805, Romania). The pH was measured in the supernatant suspension of 1:5 sediment:water (w/v) mixtures.21 The electrical conductivity (EC) was measured in 1:5 sediment:water (w/v) extracts.21,22
The organic matter content of sediments was indirectly estimated through the multiplication of the total organic carbon concentration, determined by dichromate oxidation method, by conversion factor. Organic carbon present in sediment sample is oxidized completely by a known amount of excess potassium dichromate in sulfuric acid medium and the remaining potassium dichromate is then titrated against ferrous ammonium sulfate using ferroin as an indicator. The dichromate consumed by the sample is equivalent to all oxidizable organic carbon.21,23
The carbonates of sediments were determined by back titration method where calcium carbonate present in sediment sample is neutralized with a known amount of excess hydrochloric acid and the remaining hydrochloric acid is then titrated against sodium carbonate using methyl orange as an indicator. The hydrochloric acid consumed by the sample is equivalent to carbonate content.21
For heavy metals analysis, sediment samples were digested before determining total metals using nitric acid-hydrochloric acid digestion technique.20,21. 0.5 g of oven-dried sample, ground to 250 µm particle size, was transferred to a 250 mL beaker, moisten with 0.5 to 1 mL distilled water, 10 mL HNO3-HCl digestion mixture was added and the beaker was swirled to control effervescence and to ensure good mixing then covered with a watch glass to minimize contamination. The sample was brought to a slow boiling on a hot plate and evaporated to the lowest volume possible before dryness. Concentrated HNO3-HCl digestion mixture was slowly added as indicated previously in 5 mL increments as necessary until digestion was completed as shown by a light-colored clear solution. The solution was cooled to room temperature, then the digestion solution was filtered through a GF/C filter paper (Macherey-Nagel MN GF-3, Germany). The filtrate was transferred to a 25 mL volumetric flask and completed to mark with bidistilled water. Total Fe, Mn, Zn, Cu and Pb concentrations were analyzed by flame atomic absorption spectrometer (Thermo Scientific iCE 3500, USA).
Statistical analysis
Pearson’s correlation coefficients (r) among the measured parameters were examined using IBM SPSS Statistics 16 software package.
Pollution indices
Five pollution indices were used to investigate the contamination levels of the studied heavy metals (Fe, Mn, Zn, Cu and Pb) in River Nile sediments, which are as following:
Enrichment factor (EF)
The enrichment factor was used to monitor the level of pollutants and the possible anthropogenic effect in River Nile sediments. The geochemical normalization of the examined heavy metal with respect to a conservative element such as Si, Fe or Al was employed.24 Several authors successfully used Fe to normalize heavy metal contaminants.25-27 In the present study, Fe was used as a conservative element.
The enrichment factor value was calculated according to the modified equation28,29 as follows:
EF = (Cn/CFe)sample /(Bn/BFe)background
where Cn is the concentration of the examined element in the sediment sample, CFe is the concentration of the reference element (Fe) in the sediment sample, Bn is the background concentration of the examined element, and BFe is the background concentration of the reference element (Fe).
Several authors usually refer to world average shale,30 world surface rock31 and/or upper continental crust compositions32 as natural background reference, but these data are not representative of the local lithology and can mislead the interpretations.33 To overcome this difficulty, we used in this study the average values of available local background references for Fe, Mn, Zn, Cu and Pb determined by Toufeek,11 Abdel-Satar,12 Moalla et al.14 and El-Kammar et al.15 which are 20867, 1299, 128, 42 and 25 mg/kg, respectively.
Geo-accumulation index (Igeo)
Geo-accumulation (Igeo) is a common approach employed to estimate the sediment enrichment of metal concentrations.34 The Igeo values were calculated for the studied metals using the following equation35:
Igeo= log2 (Cn /1.5 Bn)
where Cn is the concentration of the examined metal in the sediment sample, Bn is the geochemical background concentration of the examined element, and the factor 1.5 is used to minimize the effect of possible variations in the background values which may be attributed to lithologic variations in the sediments.36
Contamination factor (Cf)
The level of contamination in sediment was carried out using the Cf factor suggested by Hakanson37 and calculated as follows:
Cf = Cn/Bn
where Cn is the concentration of the examined element in the sediment and Bn is the geochemical background concentration of the examined metal.
Modified degree of contamination (mCd)
The numeric sum of the eight contamination factors for eight pollutant species (Hg, Pb, Zn, As, Cu, Cr, Cd and the organic pollutant PCB) expressed the overall degree of sediment contamination (Cd), and all the eight species must be analyzed in order to calculate the correct Cd .37 As a result of these limitations, modified and generalized form of the Hakanson's equation was presented by Abrahim38 for the calculation of the overall degree of contamination (mCd) as follows:
where n is the number of analyzed elements or pollutants and Cf is the contamination factor of the examined element in the sediment sample.
Pollution load index (PLI)
The pollution load index (PLI) was expressed as the ð‘›th root of the multiplied contamination factors of the examined elements in sediment39 as follows:
PLI = (Cf1 x Cf2 x Cf3 x … x Cfn)1/n
where Cf is the contamination factor of the examined metal in the sediment and n is the number of analyzed metals.
Results and Discussion
Physicochemical characteristics
Electrical conductivity (EC)
Electrical conductivity (EC) levels in River Nile sediments at the investigated area were in the ranges of 34-3507 µs/cm, 26-3450 µs/cm, 27-3347 µs/cm and 21-2885 µs/cm during winter, spring, summer and autumn, respectively (Fig. 2). EC had a wide range from 21 µs/cm at the midstream of Kom Ombo sector (4M) during autumn to 3507 µs/cm at the east of Gezira sector (2E) during winter.
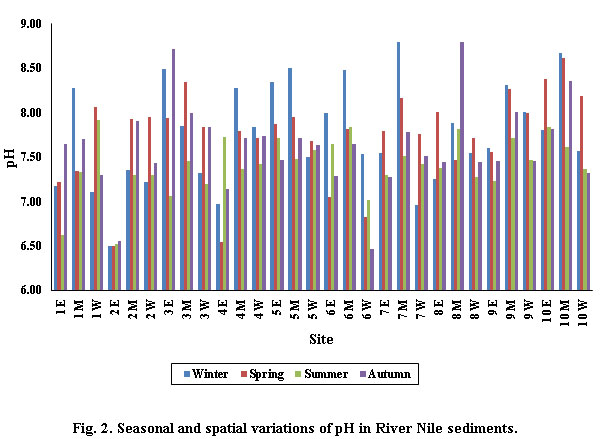 |
Figure 2: Seasonal and spatial variations of pH in River Nile sediments. |
The highest values of EC in River Nile sediments 3507 µs/cm, 3450 µs/cm, 3347 µs/cm and 2885 µs/cm were recorded at the east of Gezira sector (2E) during winter, spring, summer and autumn, respectively as a result of El-Sail drain wastewater intrusion (domestic and industrial wastewaters), and therefore contains high concentration of dissolved salts. The previous results stated that the EC levels of River Nile sediments collected from river banks were in the ranges of 690-1835 µs/cm13 and 898-2724 µs/cm.19
Hydrogen ion concentration (pH)
The seasonal variations of pH values in River Nile sediments in the studied area were in the ranges of 6.50-8.79, 6.50-8.61, 6.52-7.92 and 6.47-8.79 during winter, spring, summer and autumn, respectively (Fig. 3). The lowest pH value (6.47) was recorded at the west of Domariya sector (6W) during autumn, while the highest one (8.79) was recorded at the midstream of Sebaiya and Esna sectors (7M & 8M) during winter and autumn, respectively. These results were in agreement with those obtained by Korium et al.13 and Fawzy et al.19 on River Nile sediments, in which they recorded that the pH values of surface sediments were in the ranges of 6.85-8.15 and 7.60-8.40, respectively. The lowest recorded pH values in River Nile sediments may be attributed to the bacterial and fungal action in the sediments, where these activities liberate methane and hydrogen sulfide as well as the formation of organic acids and other breakdown products.40
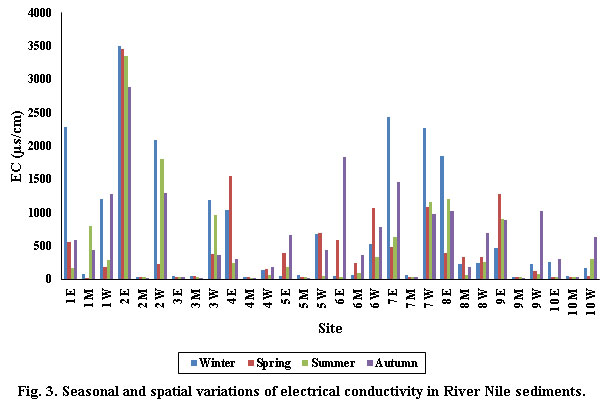 |
Figure 3: Seasonal and spatial variations of electrical conductivity in River Nile sediments. |
Organic matter (OM)
Organic matter (OM) levels in River Nile sediments at the investigated area were in the ranges of 0.11-12.86%, 0.04-12.66%, 0.08-12.30% and 0.12-9.75% during winter, spring, summer and autumn, respectively (Fig. 4). OM ranged between the minimum value (0.04%) at the midstream of Farisiya sector (9M) and the eastern bank of Armant sector (10E) during spring, and the maximum value (12.86%) at the eastern bank of Gezira sector (2E) at winter. These results agreed with that obtained by Abdel-Satar12 on River Nile sediments at which OM values were in the range of 0.23-11.35%.
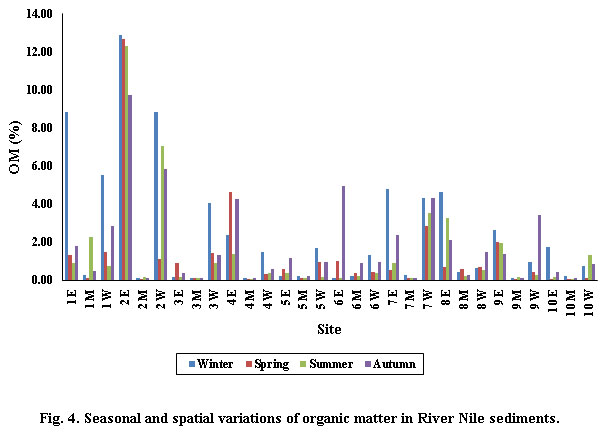 |
Figure 4: Seasonal and spatial variations of organic matter in River Nile sediments. |
The highest values of OM 12.86%, 12.66%, 12.30% and 9.75% at the eastern bank of Gezira sector (2E) during winter, spring, summer and autumn, respectively can be attributed to El-Sail drain, which receives domestic and industrial wastewaters and directly disposed into River Nile. In contrast, the lowest values of OM in River Nile sediments were determined at the midstream of sectors as a result of the water current which minimize the precipitation and deposition of dead aquatic plants and different wastes.
Carbonate
The seasonal variations of carbonate content values in River Nile sediments at the investigated area were in the ranges of 1.34-14.20%, 0.64-18.80%, 1.24-17.76% and 0.80-23.80% during winter, spring, summer and autumn, respectively (Fig. 5). The lowest carbonate content value (0.64%) was recorded at the midstream of Khattara sector (3M) in spring and the highest one (23.80%) was detected at the west of Sebaiya sector (7W) in autumn.
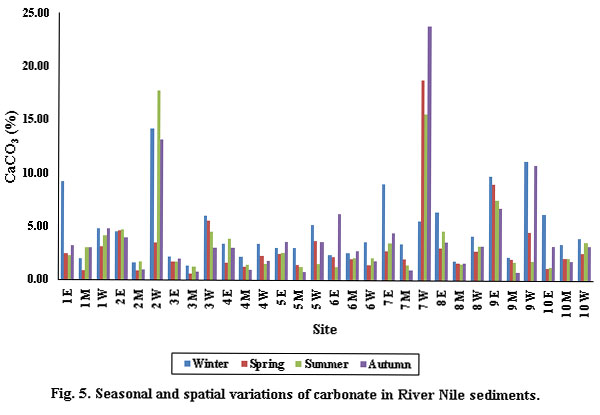 |
Figure 5: Seasonal and spatial variations of carbonate in River Nile sediments |
The highest values of carbonate 14.20% and 17.76% at the west of Gezira sector (2W) in winter and summer, respectively may be attributed to the enrichment of sediment by mollusca and partly by calcareous fragment.12 While the highest values of carbonate 18.80% and 23.80% at the west of Sebaiya sector (7W) during spring and autumn, respectively may be attributed to the phosphate rocks transported from Sebaiya Phosphate Port by ships where calcium carbonate is the most abundant accessory mineral in phosphate rocks. The previous results declared that the carbonate values of River Nile sediments were in the ranges of 0.08-5.96%12, 1.34-4.71%,13 and 13.7-16.2%.19
Heavy metals content
Heavy metals (Fe, Mn, Zn, Cu and Pb) were measured in the sediment samples and tabled in Table 2. Maximum Fe concentration (55920 mg/kg) was at the west of Aswan sector (1W) during winter, while the lowest (4114 mg/kg) was at the east of Kom Ombo sector (4E) during autumn. Mn concentrations fluctuated between 78.79 mg/kg at the east of Kom Ombo sector (4E) during autumn and 1606 mg/kg at the west of Gezira sector (2W) during winter. Zn levels varied between 25.53 mg/kg at the midstream of Kom Ombo sector (4M) during summer and 406 mg/kg at the east of Gezira sector (2E) during summer. Cu levels ranged between the minimum value of 5.63 mg/kg at the midstream of Khattara sector (3M) during summer and the maximum value of 184.3 mg/kg at the eastern bank of Kom Ombo sector (4E) during spring. The highest Pb value (76.53 mg/kg) was recorded at the east of Gezira sector (2E) during spring, while the lowest one (0.01 mg/kg) was recorded at the midstream of Sebaiya and Armant sectors (7M & 10M) during summer.
Table 2: Levels of studied heavy metals (Mean ± SD) of River Nile sediments during 2015.
|
Site |
Fe |
Mn |
Zn |
|||
|
|
Mean ± SD |
Range |
Mean ± SD |
Range |
Mean ± SD |
Range |
|
1E |
23555 ± 6043 |
15130-29100 |
554.79 ± 509.55 |
254.55-1317 |
58.43 ± 9.40 |
49.15-68.54 |
|
1M |
22094 ± 5772 |
16271-29850 |
380.33 ± 264.12 |
189.63-771.30 |
52.07 ± 13.39 |
37.21-67.23 |
|
1W |
40923 ± 16710 |
17108-55920 |
553.21 ± 294.92 |
271.05-833.63 |
74.37 ± 8.63 |
68.30-86.81 |
|
2E |
32386 ± 8962 |
19012-37650 |
308.54 ± 65.92 |
231.97-370.35 |
368.30 ± 43.37 |
309.88-406 |
|
2M |
16274 ± 3888 |
10451-18490 |
247.58 ± 57.06 |
190-315.78 |
40.71 ± 8.45 |
30.02-48.58 |
|
2W |
24769 ± 9769 |
12138-35253 |
687.52 ± 669.21 |
177.50-1606 |
66.36 ± 2.36 |
64.48-69.82 |
|
3E |
17355 ± 5769 |
11787-22785 |
304.60 ± 105.17 |
149.69-378.34 |
47.71 ± 15.41 |
36.51-70.32 |
|
3M |
15361 ± 2887 |
12074-18720 |
267.45 ± 77.94 |
216.42-383.45 |
38.24 ± 9.19 |
28.45-48.92 |
|
3W |
22582 ± 12390 |
13015-39954 |
353.88 ± 227.48 |
176.73-668.11 |
65.10 ± 28.61 |
47.32-107.83 |
|
4E |
12273 ± 5724 |
4114-16429 |
171.83 ± 124.84 |
78.79-356.03 |
71.36 ± 18.59 |
49.83-89.69 |
|
4M |
13992 ± 3719 |
9341-18090 |
237.35 ± 61.29 |
186.48-325.39 |
33.83 ± 7.14 |
25.53-41.16 |
|
4W |
26821 ± 10264 |
16556-39085 |
360.90 ± 62.69 |
282.27-435 |
62.98 ± 30.90 |
38.05-107.17 |
|
5E |
27844 ± 10180 |
15109-37184 |
566.46 ± 222.60 |
271.32-766.10 |
58.02 ± 21.99 |
28.15-78.48 |
|
5M |
19937 ± 8678 |
14176-32860 |
317.73 ± 76.79 |
224.49-401.54 |
40.24 ± 9.00 |
32.26-49.95 |
|
5W |
27046 ± 7362 |
19640-36970 |
468.54 ± 180.63 |
271.38-655.88 |
73.15 ± 25.37 |
44.27-103.02 |
|
6E |
21946 ± 4466 |
15251-24305 |
321.48 ± 50.67 |
247.07-357.13 |
57.35 ± 37.93 |
26.64-111.52 |
|
6M |
23962 ± 4465 |
19402-30040 |
505.61 ± 411.31 |
132.37-1070 |
51.48 ± 12.88 |
40.25-70.03 |
|
6W |
24495 ± 7196 |
15932-32425 |
546.78 ± 632.12 |
168.68-1492 |
53.38 ± 5.91 |
45.05-57.79 |
|
7E |
31698 ± 5776 |
23486-36544 |
641.30 ± 176.11 |
427.39-819.20 |
72.02 ± 13.85 |
55.12-87.36 |
|
7M |
20300 ± 5519 |
13664-26210 |
281.95 ± 72.56 |
225-383.69 |
42.81 ± 8.88 |
33.40-50.83 |
|
7W |
28660 ± 11446 |
17129-41689 |
1152 ± 236.12 |
934.92-1446 |
116.93 ± 23.07 |
97.86-147.68 |
|
8E |
37922 ± 10239 |
24273-47961 |
697.68 ± 390.25 |
352.87-1247 |
73.02 ± 10.71 |
57.13-79.70 |
|
8M |
21045 ± 6534 |
13069-28744 |
291.19 ± 77.49 |
217.46-398.47 |
48.80 ± 4.48 |
42.79-52.97 |
|
8W |
31255 ± 6607 |
23213-38444 |
827.79 ± 233.08 |
621-1034 |
74.18 ± 15.85 |
55.28-93.14 |
|
9E |
34275 ± 7040 |
25315-42104 |
696.47 ± 222.42 |
530.50-1023 |
76.46 ± 28.05 |
49.37-112.82 |
|
9M |
14644 ± 2862 |
11937-18160 |
207.36 ± 26.16 |
175.11-237.89 |
41.83 ± 8.53 |
32.53-49.25 |
|
9W |
20913 ± 2366 |
18575-23369 |
591.65 ± 336.37 |
241.58-1051 |
54.20 ± 20.20 |
37.31-83.53 |
|
10E |
29961 ± 10257 |
20602-44446 |
493.34 ± 125.96 |
368.83-668.51 |
58.02 ± 20.82 |
34.93-81.10 |
|
10M |
15322 ± 3907 |
9771-18310 |
249.17 ± 79.66 |
174.84-352.30 |
37.84 ± 2.56 |
36.26-41.63 |
|
10W |
22569 ± 7189 |
17958-33295 |
546.28 ± 219.48 |
346-776.29 |
71.27 ± 29.49 |
40.90-103.46 |
|
Site |
Cu |
Pb |
||
|
|
Mean ± SD |
Range |
Mean ± SD |
Range |
|
1E |
20.16 ± 13.13 |
9.61-39.32 |
8.32 ± 7.70 |
2.86-19.72 |
|
1M |
15.67 ± 5.85 |
11.95-24.39 |
8.21 ± 4.53 |
2.37-12.70 |
|
1W |
29.46 ± 6.93 |
21.56-38.46 |
6.06 ± 3.61 |
1-9.42 |
|
2E |
98.12 ± 12.99 |
79.42-108.83 |
48.06 ± 19.70 |
31.43-76.53 |
|
2M |
8.12 ± 1.67 |
5.75-9.52 |
1.78 ± 1.31 |
0.04-3.19 |
|
2W |
26.22 ± 11.32 |
16.89-41.38 |
28.60 ± 15.25 |
13.01-44.89 |
|
3E |
10.65 ± 1.86 |
8.23-12.20 |
1.75 ± 1.62 |
0.04-3.22 |
|
3M |
8.14 ± 2.17 |
5.63-10.75 |
1.57 ± 1.16 |
0.21-2.77 |
|
3W |
17.79 ± 10.98 |
11.88-34.26 |
2.68 ± 1.55 |
0.44-3.85 |
|
4E |
89.72 ± 70.22 |
35.84-184.33 |
4.90 ± 2.82 |
2.61-8.97 |
|
4M |
11.15 ± 1.16 |
9.95-12.35 |
1.14 ± 1.10 |
0.02-2.60 |
|
4W |
18.59 ± 9.36 |
10.13-31.77 |
1.82 ± 1.58 |
0.03-3.66 |
|
5E |
24.69 ± 9.11 |
13.94-33.83 |
2.76 ± 1.49 |
0.82-4.25 |
|
5M |
10.60 ± 1.89 |
8.84-12.51 |
1.16 ± 0.87 |
0.04-2.16 |
|
5W |
22.25 ± 6.21 |
13.96-28.91 |
3.81 ± 3.91 |
0.02-9.25 |
|
6E |
19.19 ± 11.47 |
9.36-34.76 |
1.71 ± 1.74 |
0.03-3.93 |
|
6M |
15.33 ± 4.78 |
11.06-20.89 |
1.11 ± 1.12 |
0.02-2.66 |
|
6W |
20.14 ± 4.37 |
17.81-26.70 |
1.61 ± 1.02 |
0.50-2.55 |
|
7E |
20.14 ± 7.85 |
16.66-33.20 |
2.62 ± 1.34 |
1.12-4.22 |
|
7M |
12.29 ± 0.47 |
11.70-12.75 |
0.83 ± 1.02 |
0.01-2.31 |
|
7W |
30.68 ± 3.69 |
25.26-33.53 |
5.98 ± 2.99 |
2.82-9.81 |
|
8E |
32.19 ± 5.97 |
24.11-38.47 |
3.47 ± 0.54 |
2.77-3.93 |
|
8M |
14.26 ± 6.01 |
8.16-22.52 |
1.16 ± 0.95 |
0.03-2.27 |
|
8W |
23.93 ± 2.51 |
21.83-27.17 |
2.44 ± 0.81 |
1.27-3.09 |
|
9E |
25.34 ± 0.74 |
24.81-26.41 |
3.17 ± 1.14 |
1.65-4.29 |
|
9M |
12.06 ± 4.29 |
8.19-18.09 |
0.93 ± 0.80 |
0.19-2.04 |
|
9W |
18.49 ± 7.12 |
13.88-29.09 |
1.51 ± 1.34 |
0.14-3.36 |
|
10E |
19.78 ± 7.51 |
14.89-30.75 |
1.67 ± 1.26 |
0.04-2.91 |
|
10M |
10.84 ± 4.67 |
5.68-15.50 |
0.88 ± 0.73 |
0.01-1.59 |
|
10W |
59.64 ± 35.76 |
30.93-106.44 |
10.41 ± 7.51 |
3.21-19.20 |
The previous studies of heavy metals in River Nile sediments recorded that Fe concentrations ranged between 19600-38400 mg/kg,11 11490-15410 mg/kg,12 and 18275-23530 mg/kg.14 Mn levels were 33-2270 mg/kg,11 94-2425 mg/kg,12 615.75-1681.64 mg/kg,13 and 550-5800 mg/kg.14 Zn concentrations were 23-287 mg/kg,11 102.2-261.35 mg/kg,12 118.26-672.46 mg/kg,13 and 91.5-270 mg/kg.14 Cu values ranged between 32-122 mg/kg,11 1.93-62.60 mg/kg,12 and 30.5-41.5 mg/kg.14 Pb concentrations varied between 2.20-52.22 mg/kg,12 34.5-60.0 mg/kg,14 and 1-271 mg/kg.15**: Correlation is significant at P < 0.01
The abundance of heavy metals in River Nile sediments was in the order of Pb < Cu < Zn < Mn < Fe with mean concentrations of 24072, 461.02, 69.35, 24.99 and 5.40 mg/kg, respectively. This indicated that Fe was the most accumulated element in sediment, where this may be attributed to the fact of Fe is the highly abundant element in the earth's crust, whereas Pb was found to be the least concentration. This is in agreement with the results reported by Goher et al.8 on Lake Nasser sediments and Fawzy et al.19 on River Nile sediments.
Statistical analysis
Pearson’s correlation coefficients among the measured parameters in River Nile sediments (n = 120) are presented in Table 3.
Table 3: Correlation coefficients (r) between pH, EC, OM, CaCO3 and heavy metals in River Nile sediments
|
Parameters |
pH |
EC |
OM |
CaCO3 |
Fe |
Mn |
Zn |
Cu |
Pb |
|
pH |
1.000 |
||||||||
|
EC |
-0.642** |
1.000 |
|||||||
|
OM |
-0.584** |
0.933** |
1.000 |
||||||
|
CaCO3 |
0.182 |
0.469** |
0.492** |
1.000 |
|||||
|
Fe |
-0.303 |
0.356 |
0.307 |
0.188 |
1.000 |
||||
|
Mn |
-0.138 |
0.296 |
0.277 |
0.591** |
0.401** |
1.000 |
|||
|
Zn |
-0.518** |
0.793** |
0.829** |
0.243 |
0.306 |
0.099 |
1.000 |
||
|
Cu |
-0.551** |
0.645** |
0.641** |
0.161 |
0.194 |
0.076 |
0.653** |
1.000 |
|
|
Pb |
-0.407** |
0.700** |
0.786** |
0.283 |
0.220 |
0.077 |
0.777** |
0.554** |
1.000 |
The pH was negatively correlated with EC, OM, Zn, Cu and Pb, which indicated that the pollution of River Nile sediments with dissolved solids, organic matter and these metals resulted in pH decreasing.
The positive significant correlations of EC with OM, CaCO3, Zn, Cu and Pb indicated the association of organic matter, carbonate and these metals with dissolved solids in Nile sediments.
Organic matter was positively correlated with CaCO3, which indicated that both OM and CaCO3 were dependent. Also, there were positive significant correlations between OM with Zn, Cu and Pb which meaned that the distribution of these heavy metals in sediment was associated with organic matter accumulation41. These results agreed with the results of Khalil et al.42 on Lake Burullus sediments.
The positive significant correlations between carbonate with Mn indicated to the association of Mn with carbonate in the mode of precipitation in Nile sediments which was agreeing with the results obtained by Korium et al.13 on River Nile sediments.
Based on the observed associations, organic matter seemed to be the principal carrier phase for some heavy metals (Zn, Cu, Pb) in the studied River Nile sediments because it had a large supportive capacity12.
Also, the positive correlations of Fe/Mn, Zn/Cu, Zn/Pb and Cu/Pb indicated that each two elements were closely associated with each other and originated from a common source in Nile sediments43.
Pollution indices
Enrichment factor (EF)
Five contamination categories44 are recognized on the basis of the enrichment factor (Table 4).
Enrichment factor values of the measured heavy metals in River Nile sediments are presented in Fig. 6.
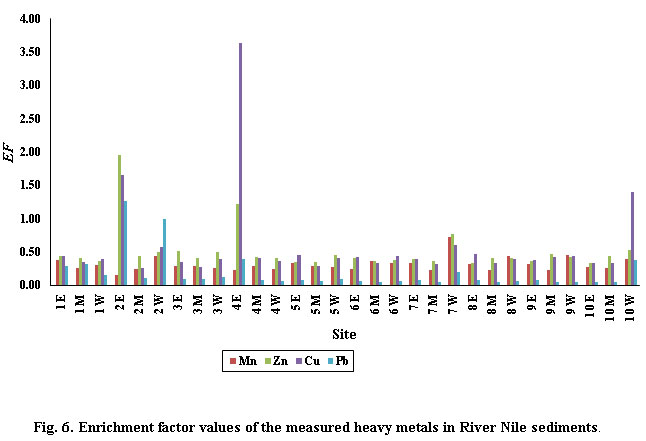 |
Figure 6: Enrichment factor values of the measured heavy metals in River Nile sediments. |
Table 4: Enrichment factor categories44 in sediments.
|
EF value |
Category |
|
EF < 2 |
Depletion to minimal enrichment, suggestive of no or minimal pollution |
|
EF = 2 – 5 |
Moderate enrichment, suggestive of moderate pollution |
|
EF = 5 – 20 |
Significant enrichment, suggestive of a significant pollution signal |
|
EF = 20 – 40 |
Very high enrichment, indicating a very strong pollution signal |
|
EF > 40 |
Extremely high enrichment, indicating an extreme pollution signal |
According to the above suppositions listed in Table 4, River Nile sediments in the studied area had minimal enrichment of Mn, Zn, Cu and Pb except for that collected from the east of Kom Ombo sector (4E), which showed moderate enrichment of Cu. This pollution may be regarded to the industrial wastewater disposed from Kom Ombo Sugar Cane Factory through Kom Ombo drain into River Nile.
Geo-accumulation index (Igeo)
Seven classes of the geo-accumulation index has been distinguished by Muller35 as indicated in Table 5.
Table 5: Geo-accumulation index classes35 for contamination levels in sediments.
|
Igeo class |
Igeo value |
Contamination level |
|
0 |
Igeo ≤ 0 |
Practically uncontaminated |
|
1 |
0 < Igeo < 1 |
Uncontaminated to moderately contaminated |
|
2 |
1 < Igeo < 2 |
Moderately contaminated |
|
3 |
2 < Igeo < 3 |
Moderately to heavily contaminated |
|
4 |
3 < Igeo < 4 |
Heavily contaminated |
|
5 |
4 < Igeo < 5 |
Heavily to extremely contaminated |
|
6 |
5 < Igeo |
Extremely contaminated |
The calculated Igeo values of the investigated heavy metals in River Nile sediments are illustrated in Fig. 7.
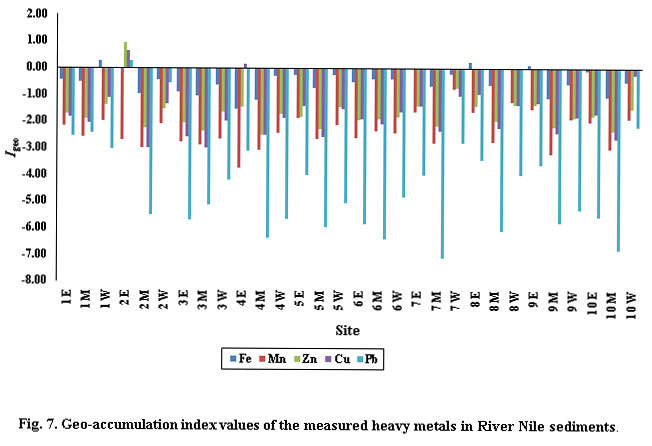 |
Figure 7: Geo-accumulation index values of the measured heavy metals in River Nile sediments. |
The Igeo values for the heavy metals (Fe, Mn, Zn, Cu and Pb) exhibited a zero class indicating uncontaminated sediments except for those collected from certain sites. The west of Aswan sector (1W), the east of Gezira sector (2E), the east of Sebaiya sector (7E), the east of Esna sector (8E), and the east of Farisiya sector (9E) were all uncontaminated to moderately contaminated with Fe. This contamination may be due to that this element (Fe) is naturally high in the sediments. The east of Gezira sector (2E) was uncontaminated to moderately contaminated with Zn, Cu and Pb. This contamination may be as a result of the dumping of El-Sail drain wastewater which contains high levels of these elements. The east of Kom Ombo sector (4E) was uncontaminated to moderately contaminated with Cu. This contamination may be due to the industrial wastewater disposed from Kom Ombo Sugar Cane Factory through Kom Ombo drain into River Nile.
Contamination factor (Cf)
Hakanson37 defines four categories for the contamination factor (Cf) as illustrated in Table 6.
Table 6: Contamination factor categories in sediments37.
|
Cf value |
Contamination level |
|
Cf < 1 |
Low contamination factor indicating low degree of contamination |
|
1 ≤ Cf < 3 |
Moderate contamination factor indicating moderate degree of contamination |
|
3 ≤ Cf < 6 |
Considerable contamination factor indicating considerable degree of contamination |
|
6 ≤ Cf |
Very high contamination factor indicating very high degree of contamination |
The Cf levels of the measured heavy metals in River Nile sediments are indicated in Table 7.
Table 7: Contamination factor levels of the measured heavy metals in River Nile sediments.
|
Site |
Fe |
Mn |
Zn |
Cu |
Pb |
|
1E |
1.129 |
0.427 |
0.456 |
0.480 |
0.333 |
|
1M |
1.059 |
0.293 |
0.407 |
0.373 |
0.328 |
|
1W |
1.961 |
0.426 |
0.581 |
0.701 |
0.242 |
|
2E |
1.552 |
0.238 |
2.877 |
2.336 |
1.922 |
|
2M |
0.780 |
0.191 |
0.318 |
0.193 |
0.071 |
|
2W |
1.187 |
0.529 |
0.518 |
0.624 |
1.144 |
|
3E |
0.832 |
0.234 |
0.373 |
0.254 |
0.070 |
|
3M |
0.736 |
0.206 |
0.299 |
0.194 |
0.063 |
|
3W |
1.082 |
0.272 |
0.509 |
0.424 |
0.107 |
|
4E |
0.588 |
0.132 |
0.557 |
2.136 |
0.196 |
|
4M |
0.671 |
0.183 |
0.264 |
0.266 |
0.045 |
|
4W |
1.285 |
0.278 |
0.492 |
0.443 |
0.073 |
|
5E |
1.334 |
0.436 |
0.453 |
0.588 |
0.110 |
|
5M |
0.955 |
0.245 |
0.314 |
0.252 |
0.046 |
|
5W |
1.296 |
0.361 |
0.572 |
0.530 |
0.152 |
|
6E |
1.052 |
0.247 |
0.448 |
0.457 |
0.068 |
|
6M |
1.148 |
0.389 |
0.402 |
0.365 |
0.044 |
|
6W |
1.174 |
0.421 |
0.417 |
0.480 |
0.064 |
|
7E |
1.519 |
0.494 |
0.563 |
0.575 |
0.105 |
|
7M |
0.973 |
0.217 |
0.334 |
0.293 |
0.033 |
|
7W |
1.373 |
0.887 |
0.913 |
0.730 |
0.239 |
|
8E |
1.817 |
0.537 |
0.570 |
0.766 |
0.139 |
|
8M |
1.009 |
0.224 |
0.381 |
0.339 |
0.046 |
|
8W |
1.498 |
0.637 |
0.580 |
0.570 |
0.098 |
|
9E |
1.643 |
0.536 |
0.597 |
0.603 |
0.127 |
|
9M |
0.702 |
0.160 |
0.327 |
0.287 |
0.037 |
|
9W |
1.002 |
0.455 |
0.423 |
0.440 |
0.061 |
|
10E |
1.436 |
0.380 |
0.453 |
0.471 |
0.067 |
|
10M |
0.734 |
0.192 |
0.296 |
0.258 |
0.035 |
|
10W |
1.082 |
0.421 |
0.557 |
1.420 |
0.417 |
According to the Cf levels (Table 7), River Nile sediments in the studied area had moderate contamination of Fe except for those collected from the midstream of Gezira sector (2M), the east and the midstream of Khattara sector (3E & 3M), the east and the midstream of Kom Ombo sector (4E & 4M), the midstream of Atwany sector (5M), the midstream of Sebaiya sector (7M), the midstream of Farisiya sector (9M), and the midstream of Armant sector (10M) which showed low degree of contamination with Fe. Though the concentration of Fe in the majority of River Nile sediments at the studied area had a contamination factor (Cf) greater than 1, it is not a priority pollutant. This may be regarded to that this element (Fe) is naturally high in the sediments .
The Cf values for Mn, Zn, Cu and Pb in River Nile sediments at the studied area were less than 1 indicating low contaminated sediments except for those collected from certain sites. The east of Gezira sector (2E) showed moderate contamination of Zn, Cu and Pb. This contamination may be due to the dumping of El-Sail drain wastewater, which contains high levels of these elements. The west of Gezira sector (2W) showed moderate contamination of Pb. The main source of contamination with this element (Pb) may be due to the leaded petrol used in outboard boat engines. The east of Kom Ombo sector (4E) showed moderate contamination of Cu. This contamination may be as a result of the industrial wastewater disposed from Kom Ombo Sugar Cane Factory through Kom Ombo drain into River Nile. The west of Armant sector (10W) showed moderate contamination of Cu. This contamination may be due to the industrial wastewater disposed from Armant Sugar Cane Factory into River Nile.
Modified degree of contamination (mCd)
The mCd classification and description34 are presented in Table 8. The mCd levels of sediments with heavy metals are shown in Fig. 8.
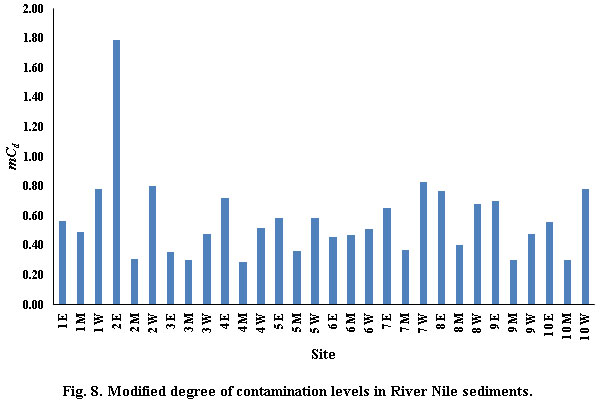 |
Figure 8: Modified degree of contamination levels in River Nile sediments |
Table 8: Modified degree of contamination classification in sediments34.
|
mCd value |
Modified degree of contamination level |
|
mCd < 1.5 |
Nil to very low degree of contamination |
|
1.5 ≤ mCd < 2 |
Low degree of contamination |
|
2 ≤ mCd < 4 |
Moderate degree of contamination |
|
4 ≤ mCd < 8 |
High degree of contamination |
|
8 ≤ mCd < 16 |
Very high degree of contamination |
|
16 ≤ mCd < 32 |
Extremely high degree of contamination |
|
32 ≤ mCd |
Ultra high degree of contamination |
The mCd levels in River Nile sediments at the studied area were less than 1.5 indicating very low degree of contamination except for the sediment collected from the eastern bank of Gezira sector (2E), which had a low degree of contamination (mCd = 1.785). This may be due to El-Sail drain contamination, which receives industrial and domestic wastewaters and directly disposed into River Nile.
Pollution load index (PLI)
The PLI provides a simple comparative means for the level of heavy metal pollution. The PLI values of unity indicate heavy metal loads near to the background level and that above 1 indicate pollution45. The pollution load index of sediments with heavy metals is shown in Fig. 9.
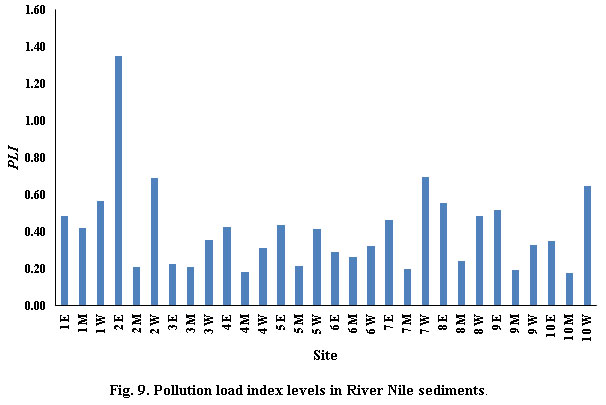 |
Figure 9: Pollution load index levels in River Nile sediments |
The PLI values of River Nile sediments at the studied area were below the unity indicating unpolluted sediments except for that collected from the east of Gezira sector (2E), which was classified as polluted (PLI = 1.348). This may be regarded to El-Sail drain pollution, which receives industrial and domestic wastewaters and directly disposed into River Nile.
Conclusion
The abundance of heavy metals in the Nile sediments at the studied area was in the order of Pb < Cu < Zn < Mn < Fe indicating that Fe was the most accumulated element in sediments, whereas Pb was found to be the least concentration. Organic matter seemed to be the principal carrier phase for heavy metals in the studied River Nile sediments because it had large sorptive capacity.
According to the pollution indices for the studied heavy metals (EF, Igeo, Cf, mCd and PLI), River Nile sediments were not contaminated with these heavy metals except for some sediment samples collected from certain sites due to the anthropogenic influences at these sites.
Acknowledgments
The authors wish to thank their colleagues at the National Institute of Oceanography and Fisheries (Aswan Branch, Egypt) for their technical help, and also would like to express their thanks to the chemists in High Dam Lake Development Authority and Environmental Studies Unit at Aswan University for their assistance in heavy metals analysis.
References
- Dumont H. J. The Nile: origin, environments, limnology and human use (Vol. 89). Springer Science & Business Media (2009).
- Khan A. A., Abdel-Gawad S., Khan H. A real time water quality monitoring network and water quality indices for River Nile. In 13th IWRA world water congress (p. 1-4) (2008).
- Ibrahim H. S., Ibrahim M. A., Samhan F. A. Distribution and bacterial bioavailability of selected metals in sediments of Ismailia Canal, Egypt. Journal of hazardous materials, 168(2-3), 1012-1016 (2009).
- El-Bouraie M. M., El-Barbary A. A., Yehia M. M., Motawea, E. A. Heavy metal concentrations in surface river water and bed sediments at Nile Delta in Egypt. Suo, 61(1), 1-12 (2010).
- Fernandes C., Fontaínhas-Fernandes A., Cabral D., Salgado M. A. Heavy metals in water, sediment and tissues of Liza saliens from Esmoriz–Paramos lagoon, Portugal. Environmental Monitoring and Assessment, 136(1), 267-275 (2008).
- Lukman S., Essa M. H., Mu'azu N. D., Bukhari A., Basheer C. Adsorption and desorption of heavy metals onto natural clay material: influence of initial pH. Journal of Environmental Science and Technology, 6(1), 1-15 (2013).
- Öztürk M., Özözen G., Minareci O., Minareci E. Determination of heavy metals in fish, water and sediments of Avsar Dam Lake in Turkey. Journal of Environmental Health Science & Engineering, 6(2), 73-80 (2009).
- Goher M. E., Farhat H. I., Abdo M. H., Salem S. G. Metal pollution assessment in the surface sediment of Lake Nasser, Egypt. The Egyptian Journal of Aquatic Research, 40(3), 213-224 (2014).
- Wang S., Jia Y., Wang S., Wang X., Wang H., Zhao Z., Liu B. Fractionation of heavy metals in shallow marine sediments from Jinzhou Bay, China. Journal of Environmental Sciences, 22(1), 23-31 (2010).
- Mohamed A. W. Geochemistry and sedimentology of core sediments and the influence of human activities, qusier, safaga and hurghada harbors, red sea coast, Egypt. Egypt. J. Aquat. Res, 31, 93-103 (2005).
- Toufeek M. E. F. Studies of factors affecting the precipitation and dissolution of some major and minor elements between water and sediment on the fresh water environment in Egypt (Lake Nasser and River Nile at Aswan Zone). Ph.D Thesis, Fac. Of Sci., Al-Azhar Univ., Cairo, Egypt (1993).
- Abdel-Satar A. M. Quality of River Nile sediments from Idfo to Cairo. Egyptian Journal of Aquatic Research, 31(2), 182-199 (2005).
- Korium M. A., Toufeek M. E. F., El-Haty, E. Y. Distribution of Al, Ag, Cr, Mn, Ni, Zn and some physicochemical characteristics of River Nile water and sediment at Aswan. Egyptian Journal of Aquatic Research, 32(2), 208-225 (2006).
- Moalla S. M. N., Soltan M. E., Rashed M. N., Fawzy E. M. Evaluation of dilute hydrochloric acid and acid ammonium oxalate as extractants for some heavy metals from Nile River sediments. Chemistry and Ecology, 22(4), 313-327 (2006).
- El-Kammar A. M., Ali B. H., El-Badry A. M. M. Environmental geochemistry of River Nile bottom sediments between Aswan and Isna, Upper Egypt. Journal of Applied Sciences Research, (June), 585-594 (2009).
- Ibrahim A. T. A., Omar H. M. Seasonal variation of heavy metals accumulation in muscles of the African Catfish Clarias gariepinus and in River Nile water and sediments at Assiut Governorate, Egypt. Journal of Biology and Earth Sciences, 3(2), 236-248 (2013).
- Redwan M., Elhaddad E. Seasonal variation and enrichment of metals in sediments of Rosetta branch, Nile River, Egypt. Environmental monitoring and assessment, 188(6), 354 (2016).
- Sharaky A., Salem T., Aal A. A. Assessment of Water Quality and Bed Sediments of the Nile River from Aswan to Assiut, Egypt. The Nile River, 207-238 (2016).
- Fawzy E. M., Rashed M. N., Soltan M. E. Exposure assessment of heavy metals pollution enriched in core sediment samples of River Nile, Aswan, Egypt. Environment, Earth and Ecology, 1(1), 46-60 (2017).
- Plumb Jr, R. H. Procedures for handling and chemical analysis of sediment and water samples. State Univ of New York Coll at Buffalo Grat Lakes Lab (1981).
- Pansu M., Gautheyrou J. Handbook of soil analysis: mineralogical, organic and inorganic methods. Springer Science & Business Media (2007).
- Carter M. R., Gregorich E. G. Soil Sampling and Methods of Analysis. CRC Press (2007).
- Nelson D. W., Sommers, L. Total carbon, organic carbon, and organic matter. Methods of soil analysis. Part 2. Chemical and microbiological properties, (methodsofsoilan2), 539-579 (1982).
- Ghrefat H. A., Abu-Rukah Y., Rosen M. A. Application of geoaccumulation index and enrichment factor for assessing metal contamination in the sediments of Kafrain Dam, Jordan. Environmental monitoring and assessment, 178(1), 95-109 (2011).
- Christophoridis C., Dedepsidis D., Fytianos K. Occurrence and distribution of selected heavy metals in the surface sediments of Thermaikos Gulf, N. Greece. Assessment using pollution indicators. Journal of hazardous materials, 168(2), 1082-1091 (2009).
- Esen E., Kucuksezgin F., Uluturhan E. Assessment of trace metal pollution in surface sediments of Nemrut Bay, Aegean Sea. Environmental Monitoring and Assessment, 160(1), 257-266 (2010).
- Bhuiyan M. A. H., Suruvi N. I., Dampare S. B., Islam M. A., Quraishi S. B., Ganyaglo S., Suzuki S. Investigation of the possible sources of heavy metal contamination in lagoon and canal water in the tannery industrial area in Dhaka, Bangladesh. Environmental monitoring and assessment, 175(1), 633-649 (2011).
- Buat-Menard P., Chesselet R. Variable influence of the atmospheric flux on the trace metal chemistry of oceanic suspended matter. Earth and Planetary Science Letters, 42(3), 399-411 (1979).
- Ergin M., Saydam C., BaÅŸtürk Ö., Erdem E., Yörük R. Heavy metal concentrations in surface sediments from the two coastal inlets (Golden Horn Estuary and Izmit Bay) of the northeastern Sea of Marmara. Chemical Geology, 91(3), 269-285 (1991).
- Turekian K. K., Wedepohl K. H. Distribution of the elements in some major units of the earth's crust. Geological Society of America Bulletin, 72(2), 175-192 (1961).
- Martin J. M., Meybeck M. Elemental mass-balance of material carried by major world rivers. Marine chemistry, 7(3), 173-206 (1979).
- Taylor S. R., McLennan S. M. The geochemical evolution of the continental crust. Reviews of Geophysics, 33(2), 241-265 (1995).
- Roussiez V., Ludwig W., Monaco A., Probst J. L., Bouloubassi I., Buscail R., Saragoni, G. Sources and sinks of sediment-bound contaminants in the Gulf of Lions (NW Mediterranean Sea): a multi-tracer approach. Continental Shelf Research, 26(16), 1843-1857 (2006).
- Abrahim G. M. S., Parker R. J. Assessment of heavy metal enrichment factors and the degree of contamination in marine sediments from Tamaki Estuary, Auckland, New Zealand. Environmental monitoring and assessment, 136(1-3), 227-238 (2008).
- Muller G. Index of geoaccumulation in sediments of the Rhine River. Geojournal, 2, 108–118 (1969).
- Stoffers P., Glasby G. P., Wilson C. J., Davis K. R., Walter P. Heavy metal pollution in Wellington Harbour. New Zealand journal of marine and freshwater research, 20(3), 495-512 (1986).
- Hakanson L. An ecological risk index for aquatic pollution control. A sedimentological approach. Water research, 14(8), 975-1001 (1980).
- Abrahim G. Holocene sediments of Tamaki Estuary: characterization and impact of recent human activity on an urban estuary in Auckland, New Zealand. (2005).
- Tomlinson D. L., Wilson J. G., Harris C. R., Jeffrey D. W. Problems in the assessment of heavy-metal levels in estuaries and the formation of a pollution index. Helgoländer Meeresuntersuchungen, 33(1), 566 (1980).
- Ravindra K., Kaushik A. Seasonal variations in physico-chemical characteristics of River Yamuna in Haryana and its ecological best-designated use. Journal of Environmental Monitoring, 5(3), 419-426 (2003).
- Sekhar K. C., Chary N. S., Kamala C. T., Raj D. S., Rao A. S. Fractionation studies and bioaccumulation of sediment-bound heavy metals in Kolleru lake by edible fish. Environment International, 29(7), 1001-1008 (2004).
- Khalil M. K., Radwan A. M., El-Moselhy K. M. Distribution of phosphorus fractions and some of heavy metals in surface sediments of Burullus lagoon and adjacent Mediterranean Sea. Egyptian Journal of Aquatic Research, 33(1), 277-289 (2007).
- Abdo M. H., El-Nasharty S. M. Physico-chemical evaluations and trace metals distribution in water-surficial sediment of Ismailia Canal, Egypt. Nature and Science, 8(5), 198-206 (2010).
- Sutherland R. A. Bed sediment-associated trace metals in an urban stream, Oahu, Hawaii. Environmental geology, 39(6), 611-627 (2000).
- Cabrera F., Clemente L., Barrientos E. D., López R., Murillo J. M. Heavy metal pollution of soils affected by the Guadiamar toxic flood. Science of the Total Environment, 242(1), 117-129 (1999).

This work is licensed under a Creative Commons Attribution 4.0 International License.